
2022-2023 Winter Outlook
2021-2022 Winter Outlook
2022-2023 Winter Outlook
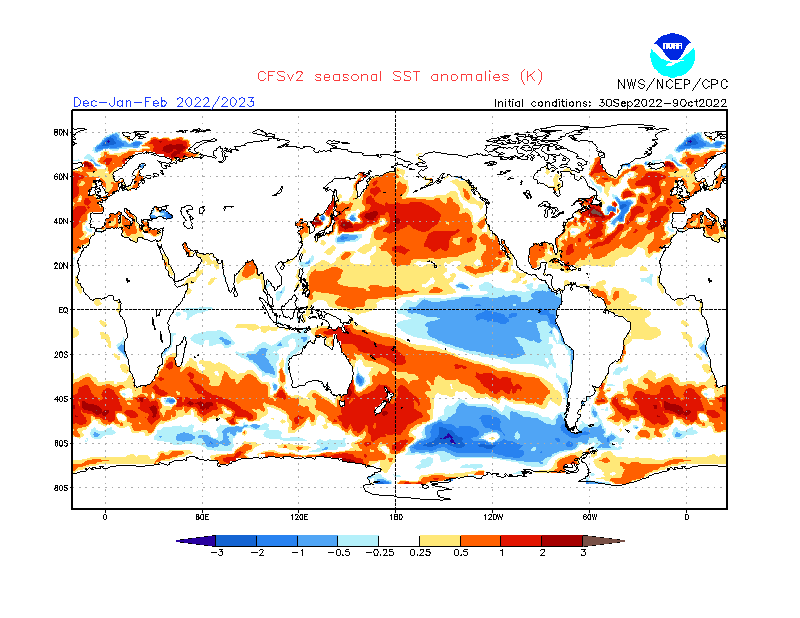
Current sea surface temperature anomalies are shown from around the world and, similar to that of the last two winters, there are La Nina conditions in the equatorial part of the Pacific Ocean (i.e., colder-than-normal water shown in blue). Map courtesy NOAA
Overview
The past two winters have featured La Nina conditions in the equatorial part of the Pacific Ocean and all signs point to a third such event for the winter of 2022-2023. While “back-to-back-to-back” La Nina episodes are not unprecedented, they are rather uncommon and analog years suggest that the third winter in this extended oceanic event is typically colder-than-normal across much of the eastern half of the nation with the coldest core of the air centered over the Upper Midwest. In addition to La Nina, another factor considered in the 2022-2023 “Winter Outlook” is the stratospheric cooling that developed earlier this year in the southern hemisphere partly as a result of unusually high levels of water vapor that were injected aloft by the powerful Hunga Tonga volcanic eruption back in January. The connection between southern hemisphere stratospheric cooling and high-latitude blocking (negative NAO) patterns in the subsequent northern hemisphere winter season is investigated.
Key Factors
Some of the key factors considered for this year’s “Winter Outlook” are listed below in order of importance:
This will be the third winter in a “back-to-back-to-back” La Nina episode
An analysis of temperature and precipitation patterns in analog years
Favorable signs for high-latitude blocking (negative NAO pattern)
Hunga Tonga volcanic eruption injected massive amounts of water vapor to the stratosphere
Stratospheric cooling formed in the southern hemisphere and it correlates well in analog years with a weakened polar vortex in the northern hemisphere during the subsequent winter season
Favorable signs for a Southeast US ridge
Last Winter
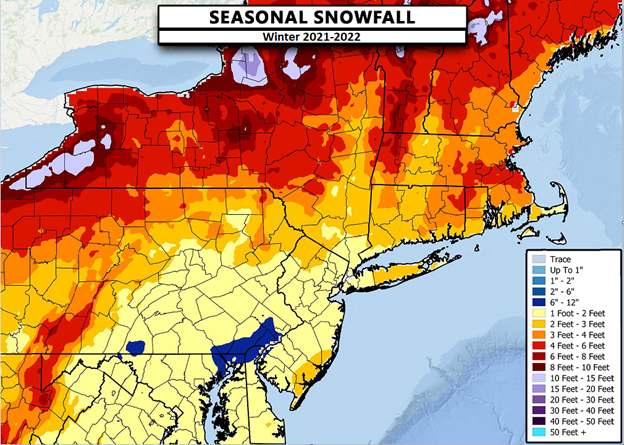
Last winter featured pretty uniform snowfall amounts of 1-2 feet in the DC-to-Philly-to-NYC corridor, but there a “snow hole” of sorts (shown in blue) across northeastern Maryland, northern Delaware and parts of southeastern Pennsylvania.
Last year’s winter season generally featured well above-normal temperatures in the Mid-Atlantic region during the month of December, but then a colder-than-normal month took place in January. The next two months were slightly warmer-than-normal in the DC-to-Philly-to-NYC corridor yielding an overall warmer-than-normal winter season. In terms of snowfall, many areas to the south of the Pennsylvania/Maryland border such as in the Washington, D.C. metro region, snowfall was generally near to slightly above-normal last winter; but it was generally below-normal to the north of the Mason-Dixon Line including in and around the Philly and NYC metro areas. In fact, a “snow-hole” with well below-normal snowfall amounts developed across northeastern Maryland, northern Delaware and parts of southeastern Pennsylvania.
Detailed Analysis
NOAA’s climate model known as the CFSv2 predicts there will be a moderate La Nina this winter season in the equatorial part of the Pacific Ocean (shown in blue) – the third such winter in a row. Map courtesy NOAA (issued 04 Oct 2022)
Third Straight La Nina Winter
The Pacific Ocean is the largest on the planet, covers more than 30 percent of the Earth’s surface, and is bigger than the landmass of all the continents combined. The warm waters of the equatorial Pacific Ocean store a great amount of latent heat when compared to cooler waters and breed a great deal of convection which impacts downstream ridging and troughing in the atmosphere. As such, its sea surface temperature (SST) pattern has a tremendous influence on all weather and climate around the world and the more anomalous the sea surface temperatures, the more the impact can be on the atmosphere around the world. The El Nino-Southern Oscillation (ENSO) is a recurring climate pattern involving changes in the temperature of waters in the central and eastern tropical Pacific Ocean. El Nino and La Nina are the extreme phases of the ENSO cycle; between these two phases is a third phase called ENSO-neutral.

Rolling 3-month averages of sea surface temperature anomalies as generated by a series of dynamical and statistical computer forecast models are shown in this plot for the central part of the Pacific Ocean. The compilation of model forecasts issued during September 2022 suggests a third consecutive La Nina winter is in the offing. Plot courtesy International Research Institute for Climate and Society
During the two winters, La Nina conditions (i.e., colder-than-normal water) persisted in the equatorial part of the Pacific Ocean and all signs point to a third consecutive season. A “back-to-back-to-back” La Nina winter season is not unprecedented; however, it is rather uncommon with about three such occurrences in the last fifty years or so. Some other analog years of a third winter season in a “back-to-back-to-back” La Nina episode include 1975/1976, 1985/1986 and 2000/2001. Current observations certainly support the notion of an on-going La Nina event with colder-than-normal surface-level water dominating the equatorial part of the Pacific Ocean. Elsewhere, warmer-than-normal water generally dominates the Atlantic Ocean and there is a “horseshoe” of warmer-than-normal water surrounding the colder-than-normal water (La Nina) in the equatorial Pacific Ocean. This “horseshoe” of warmer-than-normal water in the Pacific Ocean happens to be generally in the “ring of fire” region of the ocean and could be associated with increased underwater volcanic activity according to some research in recent years.
Sub-surface colder-than-normal water in the tropical Pacific Ocean (shown in blue, upper right) will likely “bubble” up to the surface in coming weeks supporting the notion of a third straight La Nina type of winter with colder-than-normal sea surface temperatures. Plot courtesy NOAA/CPC
In addition to the current “surface-level” water temperatures in the equatorial Pacific Ocean, support for a continuing La Nina this winter season come from “sub-surface” water temperatures. In fact, there has been plenty of colder-than-normal water just beneath the surface in the central and eastern Pacific Ocean in recent weeks. This “sub-surface” colder-than-normal water will likely “bubble” up to the surface level in coming weeks supporting the idea of another La Nina winter. Finally, numerous computer forecast models (dynamic and statistical) support the notion of a third straight winter with La Nina conditions predicted to continue into at least the spring season of next year.

La Nina will likely be the dominant player again this winter season in the equatorial Pacific Ocean with colder-than-normal sea surface temperatures. Typically, this type of oceanic sea surface temperature pattern leads to an active polar northern jet across Canada and much of the northern US and colder-than-normal conditions from Alaska to the Northern Plains. In addition, La Nina winters are often warmer and drier than normal in much of the southern US from California-to-Florida with a usually persistent ridge in the southeastern states.
An Analysis of Analog Seasons using the Third Winter of “Back-to-Back-to-Back” La Nina Events
It is quite useful for long-range forecasting purposes to find analog years in which there were similar overall conditions compared to today’s environment. A review of temperature and precipitation patterns in these selected analog years can provide some useful clues as to what can be expected in the forthcoming winter season. The particular three analog years chosen for this analysis was the third winter season in “back-to-back-to-back” La Nina events. The following three winters met these qualifications: 1975/1976, 1985/1986 and 2000/2001.
US temperature (left) and precipitation (right) anomalies averaged together during the December-to-March time period for the three selected analog years (i.e., using the third winter in a “back-to-back-to-back” La Nina event). Data courtesy NOAA/PSL

Temperature anomalies for the “month of December only” when averaged together for the three analog years had a clear signal of colder-than-normal conditions in much of the eastern US. This finding suggests there can be a quick start to winter weather this year in the Mid-Atlantic region. Data courtesy NOAA
When averaged together, these three analog years produced a pretty clear signal for colder-than-normal conditions in the eastern half of the nation and near-normal precipitation amounts in the Mid-Atlantic region. In addition, a look at the month temperature anomaly pattern during the month of December in the analog years suggests there can be a quick start to the winter weather conditions in the eastern half of the nation with colder-than-normal conditions. It is somewhat more difficult to get consistently colder-than-normal weather in the Mid-Atlantic/Northeast US in December compared to January or February from a climatological point of view as the Great Lakes are still unfrozen and the western Atlantic Ocean is still relatively warm compared to its usual low point in March or April.
The Hunga Tonga Volcanic Eruption
Injection of massive amounts of water vapor into the southern hemisphere stratosphere
An impact on stratospheric temperature anomalies
Potential impact on the northern hemisphere winter
High-latitude blocking
Negative North Atlantic Oscillation (NAO)
Hunga Tonga is a submarine volcano located under the South Pacific. Its violent eruption on January 15, 2022 produced a massive volcanic plume consisting of water vapor that reached all the way up into the stratosphere…one of the highest eruptions ever recorded and the largest of the century so far. The massive amount of water vapor injected into the stratosphere over the southern hemisphere has had a cooling effect achieved through the reflection of incoming solar radiation at the top of the atmosphere. It has been calculated that the volcanic eruption actually raised water vapor levels by as much as 10% which is quite an achievement for a single volcanic event.
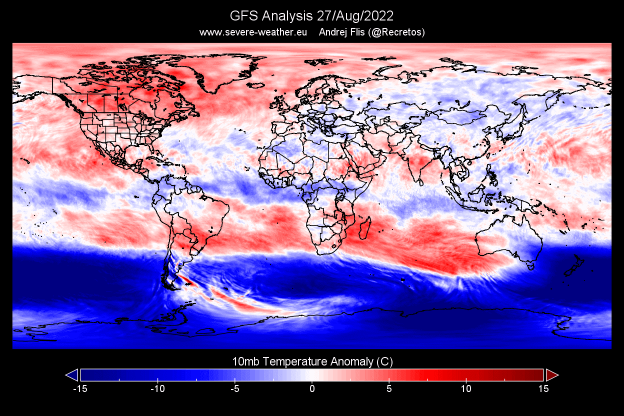
This temperature anomaly chart from late August at the 10 millibar level features widespread colder-than-normal conditions across the southern hemisphere.
If we look at Northern Hemisphere winter seasons that followed anomously cold southern hemisphere stratospheric years, there is a pretty strong correlation with negative NAO patterns and frequent high-latitude blocking featuring higher heights (pressure) compared to normal over places like Greenland. As any snow lover and weather enthusiast knows living in the Mid-Atlantic and Northeast US, it takes many ingredients to fall into place for a snowstorm to actually take place; especially, in the urban areas of DC, Philly, New York City and Boston. One requirement for accumulating snow is, of course, cold air that is near or below the freezing mark, but it can be a little more complicated than that. It is one thing to have cold air around at the beginning of a potential snowstorm, but the best chance for significant snow comes when there is sustained cold air. If there is no mechanism for “locking in” the cold air, you could very well end up with a snow-changing-to-rain scenario; especially, in the big cities along the I-95 corridor and in areas closer to the east coast.
One of the ways to sustain a cold air mass in the Mid-Atlantic/Northeast US is to have an atmospheric phenomenon known as high-latitude blocking. Normally, there is an Arctic low pressure system over the polar region where cold air tends to be trapped. This system can become displaced or even reversed in the wintertime if warmer air pushes into northern latitude regions and a “blocking” pattern can form which can unleash cold air into the middle latitudes. High-latitude blocking during the winter season is characterized by persistent high pressure in northern latitude areas such as Greenland, northeastern Canada, and Iceland. Without this type of blocking pattern in the upper atmosphere, it is more difficult to get sustained cold air masses in the central and eastern US as well as, in turn, accumulating snowfall.
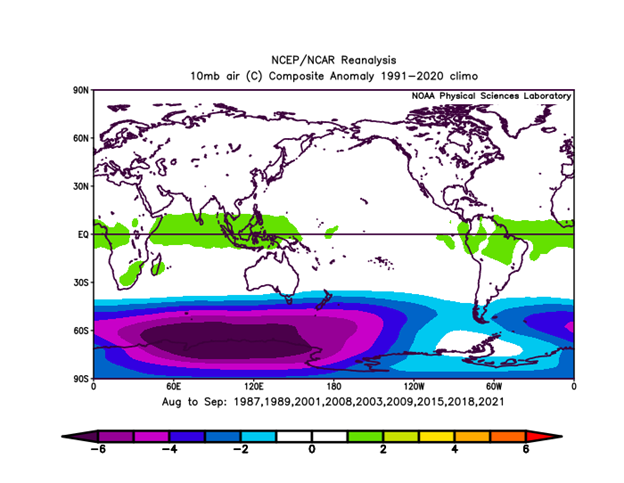
The following analog years of 1987, 1989, 2001, 2003, 2008, 2009, 2015, 2018 and 2021 featured colder-than-normal stratospheric temperatures across much of the southern hemisphere (during the August-to-September time period) as depicted by the following composite anomaly map (map courtesy NOAA/NCAR Reanalysis):
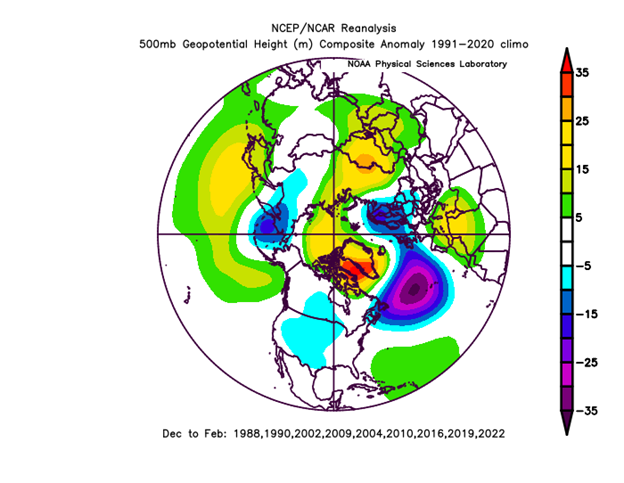
In the subsequent winter seasons in these analog years, there was a preponderance of high-latitude blocking events with higher heights than normal centered over places like Greenland (orange, yellow) as seen in the following composite anomaly plot (map courtesy NOAA/NCAR Reanalysis):
The following plot depicts graphically the differences in the jet stream with a stable polar vortex (left) and a weakened or disrupted polar vortex (right). High-latitude blocking patterns (i.e., negative NAO) would feature upper-level winds as depicted with the wavy polar vortex (right) which can unleash incursions of colder-than-normal air masses into the mid-latitudes from the polar regions.

The Bottom Line
The main factors involved in this 2022-2023 “Winter Outlook” include a comparison with analog years that featured a third winter in a “back-to-back-to-back” La Nina episode. In addition, an analysis of prior years that featured stratospheric cooling in the southern hemisphere reveals that high-latitude blocking (negative NAO pattern) is often more frequent in the subsequent northern hemisphere winter season. The stratospheric cooling in the southern hemisphere that developed this year is at least partly the result of massive amounts of water vapor injected into the upper atmosphere from a powerful submarine volcanic eruption that took place in the South Pacific during mid-January 2022.
The Mid-Atlantic region is likely to experience a colder-than-normal winter season with nearly normal-to-slightly above normal snowfall amounts. The winter could get off to a quick start compared to usual with possible persistent colder-than-normal conditions in latter November and December. In terms of specific numbers for the Mid-Atlantic region, temperatures should average from 1.0-3.0°C below-normal for the winter season. Snowfall estimates in the DC-to-Philly-to-NYC corridor are as follows:
Near to slight above normal in Washington, D.C. with 20-25 inches in the region (average at DCA Airport is 15.6”),
Near to slightly above normal in Philadelphia, PA with 25-30 inches in the region (average at PHL Airport is 22.6”),
Near to slightly above normal in New York City with 30-35 inches in the NYC metro region (average in Central Park is 26.1”).
Elsewhere across the country, the typical pattern of an La Nina winter will likely result in an active northern jet stream and a persistent ridge in the Southeast US and this should lead to generally warmer and drier than normal weather conditions across much of the western and southern US.
We will continue to closely monitor all of these oceanic and atmospheric factors over the next several weeks as we progress towards the winter of 2022-2023.