Discussion
Looks like the Mid-Atlantic region - and much of the eastern half of the nation - is going to experience another cold and snowy winter…
Overview
Last winter, much of the eastern half of the nation including the Mid-Atlantic region suffered through colder-than-normal conditions with the most severe cold relative-to-normal centered over the Upper Midwest and Great Lakes. The phrase “polar vortex” became part of the vernacular when it came to talking about the winter weather in the central and eastern US. Most of the same area also experienced above-normal snowfall with Philadelphia’s International Airport recording it 2nd snowiest ever at 68” - second only to 2009-2010 when 78.7” piled up. Reagan National Airport in Washington, DC had its 9th snowiest winter ever with 32”, and Central Park in New York City measured well-above normal amounts of 57.4”.
There are several factors listed below that point to another cold and snowy winter in the Mid-Atlantic region which would give us “back-to-back” cold and snowy winters – not all that uncommon in this part of the country (e.g., 1976-1977/1977-1978; 1983-1984/1984-1985):
1. Strong positive (warm) sea surface temperature anomaly in the northern Pacific Ocean
2. A weak-to-moderate “centrally-based” El Nino (warm) in the tropical Pacific Ocean
3. Favorable conditions for “high-latitude blocking” (low solar activity, above-normal and "expanding" autumnal snowpack, October Arctic Oscillation index signal)
Pacific Ocean sea surface temperature (SST) anomalies
Last winter featured a strong positive anomaly in sea surface temperatures in the northern Pacific Ocean and all indications are that this same anomalous pattern will continue through the upcoming winter season. Meanwhile, farther south in the tropical Pacific, there is a new feature for this winter as weak-to-moderate El Nino conditions (i.e., warmer-than-normal SSTs) have developed and should last through the winter season before perhaps withering away later next year. Currently, the center of the above-normal sea surface temperature pattern in the tropical Pacific is close to the west coast of South America; however, computer forecast models (e.g. CFSv2, JAMSTEC) suggest the weak-to-moderate El Nino should become “centrally-based” during the winter season with the warmest waters relative-to-normal shifting from the eastern Pacific to the central Pacific.
The combination of a “centrally-based” El Nino in the tropical Pacific along with the warm anomaly in the northern Pacific is likely to lead to an upper air pattern that consistently features high pressure ridging along the west coast of North America and low pressure troughing in the eastern US. This kind of upper air pattern typically allows for the frequent penetration of cold, Canadian air masses into the central and eastern US from northern Canada - as was the case quite often last winter. The similarities are truly remarkable between the expected Pacific Ocean SST anomaly pattern for this upcoming winter (warm pocket up north and "centrally-based" weak-to-moderate El Nino near the equator) and the actual one that occurred during the fifteen coldest winters in the past 60 years (see video discussion for details).
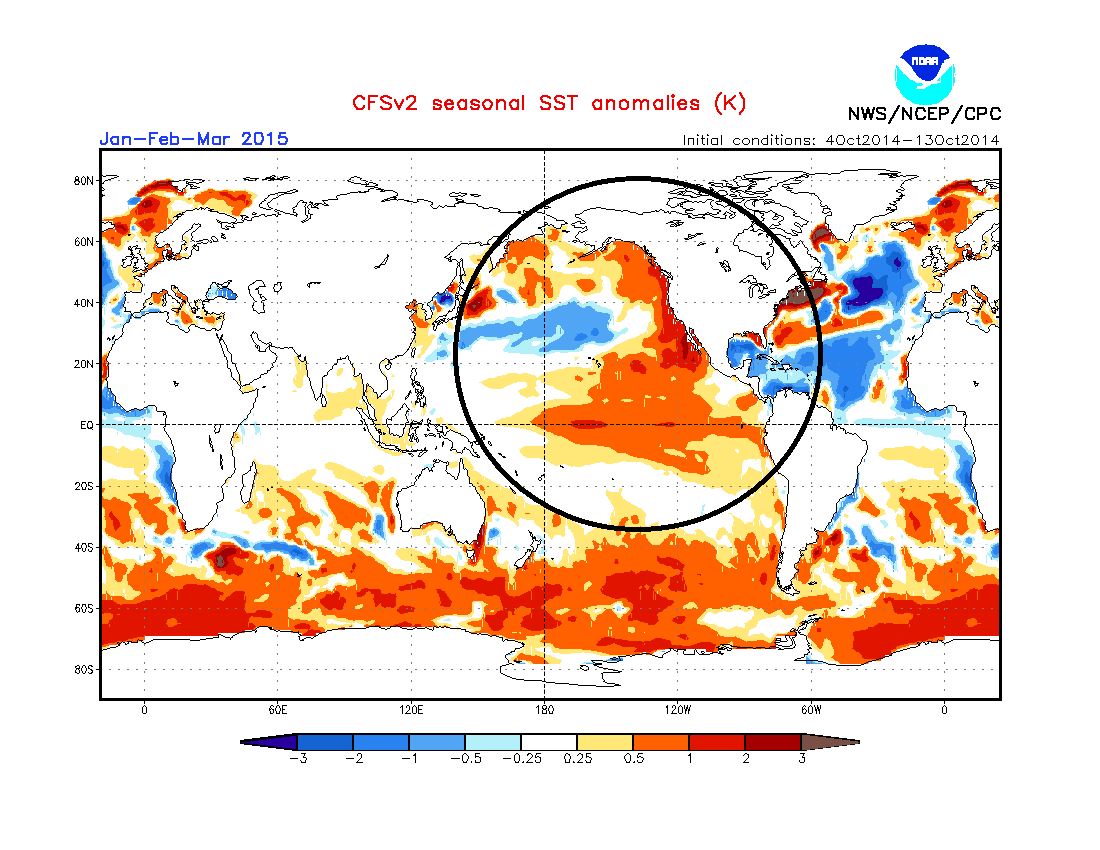 [CFSv2 SST anomalies forecast for Jan-Feb-Mar 2015; courtesy NOAA]
“High-latitude blocking” and low solar activity
In addition to the sea surface temperature anomaly pattern in the Pacific Ocean, “high-latitude blocking” is another important factor with regard to winter weather forecasting in the central and eastern U.S. “High-latitude blocking” is generally characterized by persistent high pressure in northern latitude areas such as Greenland and this typically leads to cold air outbreaks into the central and eastern U.S from northern Canada. Research has shown that low solar activity tends to be correlated with high-latitude blocking patterns and despite the fact that we are in the solar maximum phase of solar cycle 24, it is actually a period of relatively low solar activity as this solar max is one of the weakest in many decades - perhaps even the weakest in more than a century – and low solar activity is expected to continue through the winter season.
“High-latitude blocking” and the northern hemisphere snowpack
Some research studies have documented a connection between northern hemisphere snowpack during fall seasons and “high-latitude blocking” patterns in following winter seasons. Specifically, if snowpack is above-normal and consistently expanding during the fall season in many of our cold air source regions (e.g. Canada, Greenland, Siberia) then there is an increased chance for more frequent “high-latitude blocking” patterns in subsequent winter months. North America snow cover extent actually reached record highs at the end of September in records dating back all the way to 1967 (data courtesy Rutgers snow lab at http://climate.rutgers.edu/snowcover/chart_anom.php?ui_set=1&ui_region=namgnld&ui_month=9) and the entire northern hemisphere had its 3rd highest levels at the end of the month.
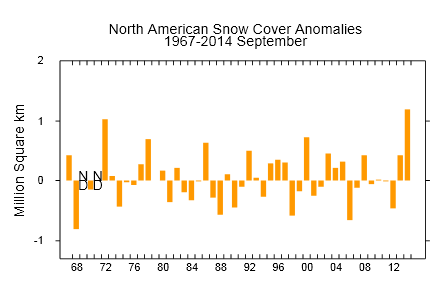 [North American snow cover anomalies at end of September (record high); courtesy Rutgers snow lab]
As far as October is concerned, the snow coverage in Eurasia (Asia in particular) is off to the races. The all-important cold air source region of Siberia has experienced consistent expansion (southward of 60°N) of its snowpack during October and research has correlated this type of autumnal snowfall in this precise part of the world with more frequent wintertime “high-latitude blocking” patterns in following winter months. In many parts of Siberia, the snow cover has rapidly advanced in recent days to levels not seen at this stage of the autumn season since at least the year 2000.
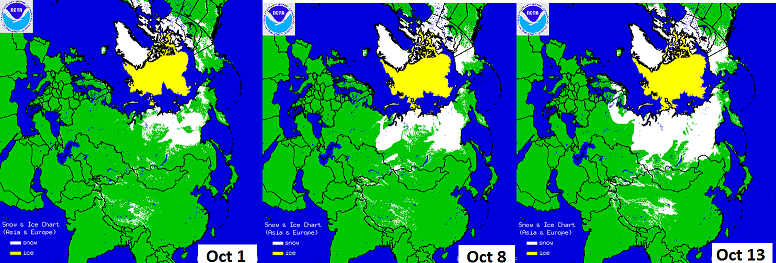 [Expansion of Siberian snow cover (in white) from early-to-mid October; courtesy NOAA]
The Arctic Oscillation index and its October signal for “high-latitude blocking”
High-latitude blocking can be tracked by meteorologists through indices known as the Arctic Oscillation (AO) and its closely-related cousin called the North Atlantic Oscillation (NAO). When the AO is positive, for example, surface pressure is low in the polar region and this helps the mid-latitude jet stream to blow strongly and consistently from west-to-east keeping Arctic air locked up in the polar region. When the AO index is negative, there tends to be high pressure in the polar regions (i.e., “high-latitude blocking”), weaker zonal winds, and greater movement of polar air into the middle latitudes. While the AO index and its closely-related cousin called the North Atlantic Oscillation (NAO) are primarily used during the winter season, trends in October can provide important clues about the ensuing winter season.
Indeed, earlier in October, the AO plunged into negative territory not seen during the month of October in over a decade. The map below shows the observed AO index value (in black) as it bottomed out at -4 on October 9th before an upturn. The lowest level ever seen for the AO index in the month of October which was -5.09 recorded on October 18th, 2002. In fact, the last time the AO was lower than -3.5 during the month of October was in 2002 and there have only been five times where the AO index has been below -4.0 during the month of October. As it turns out, when we look at the winters since 2002 that experienced an AO index below -2 during the month of October, almost every one (6 out of 7) experienced above-normal snowfall in the Mid-Atlantic region and below-normal temperatures. For example, snowfall in New York City for these particular 7 winters had an average snowfall total of 40 inches compared to the normal amount of ~25 inches and only one of those winters included below-normal snowfall. The AO and NAO indices are likely to spend much of the time this winter in negative territory indicative of frequent “high-latitude blocking” patterns. By the way, the all-time low for the AO index in any month came during the brutally cold month of January 1977 when it bottomed out at a value of -7.43.
 [Arctic Oscillation index (actual black; forecast red); courtesy NOAA]
The bottom-line
Much of the eastern two-thirds of the nation should experience another colder-than-normal winter season with the western-third of the nation (Denver-to-Los Angeles) likely to be warmer-than-normal. Overall temperatures in the Mid-Atlantic region should end up about 1.5-3.0 (degrees Celsius) below-normal for the winter season (November through March) and similar chill relative-to-normal can be expected all the way down to the Gulf coast.
Snowfall should be at least ten inches above normal amounts in the Mid-Atlantic region this winter with more than 25 inches likely in the DC metro region, more than 30 inches in and around Philly, and more than 35 inches in the New York City metro region. The winter is likely to get off to a quick start with some notable cold and snow following what is likely to be a relatively mild beginning to the month of November in the Mid-Atlantic region.
Video
httpv://youtu.be/41CDNlIzvRA

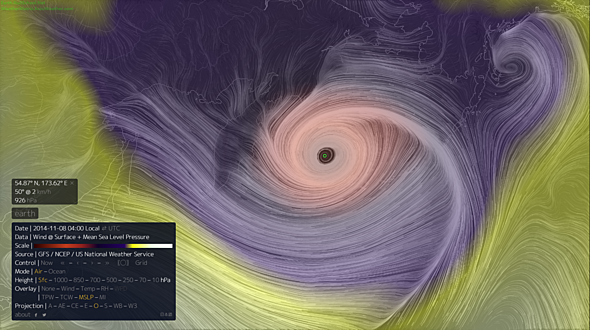 [Depiction of the forecasted wind field associated with this superstorm near Alaska; courtesy earth.nullschool.net]
 [Arctic Oscillation index: actual (black), forecast (red); courtesy NOAA]
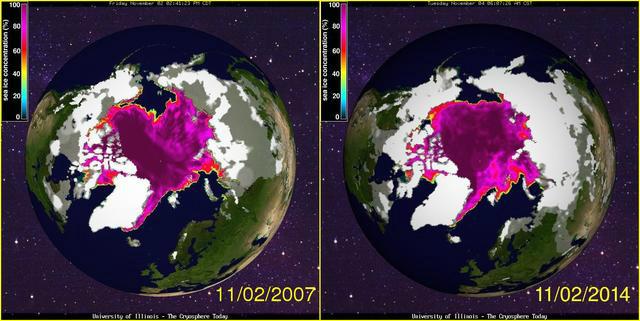 [Northern hemisphere snowcover comparison for 2007 and 2014; data courtesy University of Illinois "cryosphere"]
 [Running 9 year mean in Florida]
 (Data source: NOAA, US HCN reporting stations; Steve Goddard)
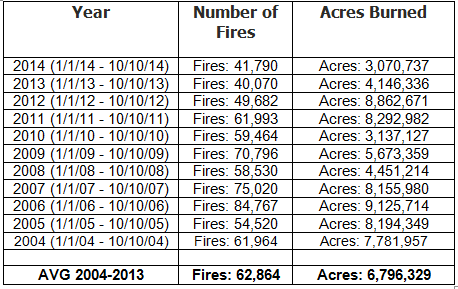 (Data source: National Interagency Fire Center;
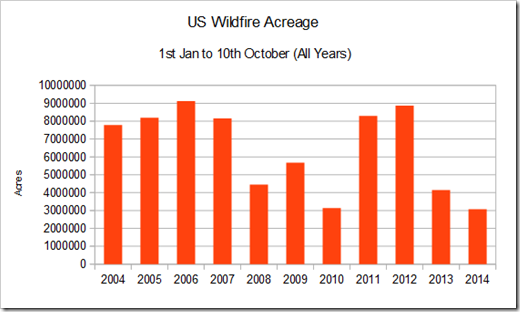
 [Record or near record lows from yesterday and this morning; data courtesy coolwx.com]
 [Snow-covered Columbia, South Carolina]
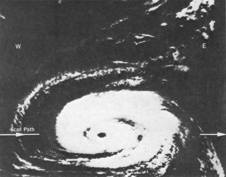 [Hurricane Gladys as seen by NASA’s Nimbus 1 satellite in September 1964; courtesy NASA]
 [GFS model forecast of the Arctic Oscillation (AO) index to the middle of October]
 [Yellow line represents 2014 southern hemisphere sea ice areal extent; courtesy University of Illinois "cryosphere" and NOAA/NCEP]
 [red line represents 2014 global sea ice areal extent relative to normal at zero line; courtesy University of Illinois "cryosphere" and NOAA/NCEP]
 [Yellow line represents 2014 northern hemisphere sea ice areal extent; courtesy University of Illinois "cryosphere" and NOAA/NCEP]
 [NASA global temperature anomalies for August 2014]
 [Current solar image with circled area showing the active sunspot region that produced a solar flare on Tuesday; courtesy spaceweather.com]