Contact Us

Use the form on the right to contact us.

You can edit the text in this area, and change where the contact form on the right submits to, by entering edit mode using the modes on the bottom right. 


123 Street Avenue, City Town, 99999

(123) 555-6789

email@address.com


You can set your address, phone number, email and site description in the settings tab.
Link to read me page with more information.

backlit-stratus-clouds-2013-04-05.jpg

Blog

Weather forecasting and analysis, space and historic events, climate information

Filtering by Category: Climate Info

4:00 PM | 2015-2016 Winter Outlook for the Mid-Atlantic Region

Paul Dorian

Overview

It looks like the Mid-Atlantic region is going to experience another snowy winter with numerous coastal storms – and there can even be a blockbuster snowstorm or two. Temperatures are likely to average out to near normal or slightly above-normal for the winter season in the Mid-Atlantic region, but there will be occasional Arctic air outbreaks as well. Warmer-than-normal weather is likely across much of the northern US and colder-than-normal conditions are expected in much of the Deep South. Last winter, the Mid-Atlantic region suffered through a snowy and cold winter and farther up the coastline, Boston, Massachusetts experienced its snowiest winter ever. If this winter does indeed produce more snow than normal in DC, Philly, and New York then it would be the third in a row which is quite uncommon around here.

Key factors

There are several key factors listed below that were involved with this year’s winter outlook:

1. Strong El Nino conditions focused in the central part of the tropical Pacific Ocean

2. A warm sea surface temperature anomaly in the northeastern Pacific Ocean

3. Warmer-than-normal sea surface temperatures near the US east coast

4. Favorable signals for “high-latitude blocking” from a) Arctic Oscillation index trend during the summer and fall, b) autumnal snowpack in the northern hemisphere, and c) low solar activity

5. Analog years: 1997-1998, 1991-1992, 1982-1983, 1957-1958, 2009-2010, 1986-1987

El Nino

A very strong El Nino event is well underway in the tropical Pacific Ocean and it will play a vital role in our upcoming winter weather. Very strong El Nino events were taking place on average about once a decade in the latter part of last century (1972-1973, 1982-1983, 1997-1998); however, the first decade of this century did not feature a comparable very strong El Nino. Instead, there were three moderate El Nino events to begin this century in the following years: 2002-2003, 2006-2007 and 2009-2010. The current El Nino is more analogous in strength to those episodes which occurred in the 1970’s, 1980’s and 1990’s.

The current El Nino began during the latter part of last year and strengthened considerably earlier this year. An El Nino of this magnitude is likely to increase the intensity of the southern branch of the jet stream during the winter season and it'll act to pump a lot of moisture into the upper-level wind flow. The southern branch of the jet stream is crucial for the development of storms in the southwestern US (e.g., California) that can then travel across the southern US and ride up the east coast (i.e., coastal storms). Strong El Nino’s have produced some blockbuster snowstorms for the Mid-Atlantic region in the past (e.g., February 1983) and the combination of the “pumped up” southern branch of the jet stream and warmer-than-normal sea surface temperatures near the US east coast raises the prospects for just such an event or two this winter.

While the magnitude of El Nino is very important as far as its potential impact on our winter weather, so is its location. A “centrally-based” El Nino is one in which the greatest sea surface temperature anomalies are located in the central tropical Pacific Ocean whereas an “eastern-based” El Nino has the warmest water relative–to-normal much closer to the west coast of South America. A “centrally-based” El Nino is more likely to be associated with an upper-level ridge of high pressure along the west coast of North America and this, in turn, can help to push cold air masses into the northeastern US. On the other hand, an “eastern-based” El Nino (e.g., 1997-1998) with its warming focused near the west coast of South America would more likely result in southwesterly winds across the eastern US producing warmer-than-normal wintertime conditions. I believe the most recent changes in the overall sea surface temperature pattern across the tropical Pacific Ocean favor the idea of a “centrally-based” El Nino this winter and multiple computer forecast models tend to support this notion (NOAA CFSv2, JAMSTEC, UKMET).

Northeastern Pacific Ocean warm pool of water

El Nino is not the only game in town as far as the winter outlook is concerned and it is important to look elsewhere. Another important region that may impact our winter weather is the northeastern Pacific Ocean where a warm pool of water has persisted for the past couple of winters. It appears that this pattern will continue through another winter season and this should help to generate high pressure ridging along the west coast of North America which, in turn, should push cold air outbreaks into the northeastern US.

Two independently-made sea surface temperature anomaly forecasts made for the upcoming winter season (below) tend to agree on the major players across the all-important Pacific Ocean. NOAA’s CFSv2 suggests the El Nino conditions will become more “centrally-based” in the Pacific Ocean during the winter season and that there will be a continuation of warmer-than-normal water in the northeastern Pacific Ocean. The JAMSTEC forecast model is produced by Japan’s Meteorological Agency and it tends to agree with the NOAA/CFSv2 forecast in the overall sea surface temperature pattern in the Pacific Ocean.

CFSv2-SST-fcst.gif

[NOAA/CFSv2 SST anomaly forecast for Dec/Jan/Feb; courtesy NOAA]
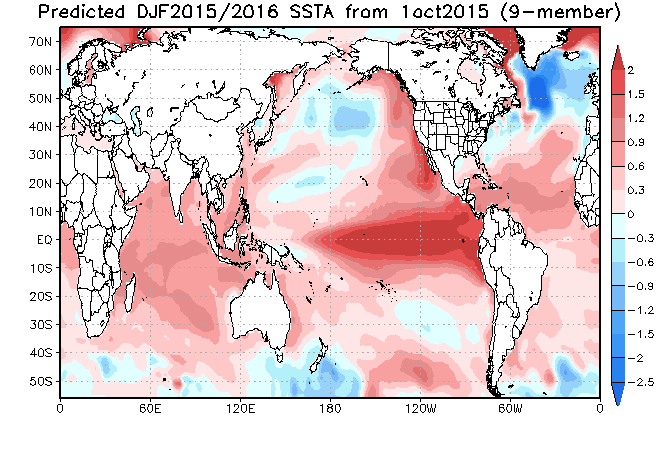
JAMSTEC1.gif

[JAMSTEC SST anomaly forecast for "Dec/Jan/Feb"; courtesy Japan Agency for Marine-Earth Science and Technology]

Analog years

While sea surface temperatures never repeat exactly from one year to another, it is still quite useful for long-range forecasting purposes to find “analog years” in which there are somewhat similar oceanic patterns to current conditions. Indeed, I believe the following winter seasons featured somewhat analogous sea surface temperature patterns compared to today’s environment and they can provide us a clue as to what type of winter we may experience around here: 1997-1998, 1991-1992, 1982-1983, 1957-1958, 2009-2010 and 1986-1987. The one overriding characteristic of these analog years is that they all featured moderate or strong El Nino events in the tropical Pacific Ocean. Note- even though there was a strong El Nino event in 1972-1973, it is not included in my analog year list as there were significant sea surface temperature differences in the northeastern Pacific Ocean compared to the today.

These particular analog winter seasons resulted in overall temperatures that averaged above-normal across the northern US and below-normal in southern areas of the US. The Mid-Atlantic region was sandwiched between these two zones with near normal or slightly above normal conditions on average during these analog years.

analog-years-temps.png

[Average Dec to Feb temperature anomaly pattern for the analog years; courtesy NOAA]

An interesting finding with respect to temperatures in these chosen analog years is revealed when looking at “month-to-month” anomalies. There was a clear tendency for the eastern US to become progressively colder relative-to-normal as the winter season evolved. Warmer-than-normal temperatures (seen in yellow, orange, red) were quite expansive in December across the eastern US during these analog years and then they retreated somewhat in January and then even more so during February.

Dec_Jan_Feb_temperatures_analog_years1.png

[Month-to-month breakdown of temperature anomalies during the analog years; courtesy NOAA]

As far as precipitation is concerned, these analog years featured on average wetter-than-normal conditions in the southern states as well as along much of both coastlines. As with temperatures, this is a somewhat typical pattern seen during winter seasons in El Nino years and is reflective of the “pumped up” southern branch of the jet stream.

analog-precip.png

[Average Dec to Feb precipitation anomaly pattern for the analog years; courtesy NOAA]

“High-latitude blocking”

If the current strong El Nino in the tropical Pacific Ocean was the only player on the field this winter then much of the US would likely experience a warmer-than-normal winter as El Nino is one of nature's best ways to redistribute heat around the world. There is an atmospheric phenomenon, however, that can counteract El Nino's potential warming in the Mid-Atlantic region during the winter season and it is known as "high-latitude blocking". As a result, it is quite important in the long-range forecasting of winter season temperatures in the Mid-Atlantic region to evaluate the prospects for “high latitude blocking”.

“High-latitude blocking” during the winter season is generally characterized by persistent high pressure in northern latitude areas such as Greenland and northern Canada. Without this type of pattern in the atmosphere, it would be quite difficult to get sustained cold air masses in the Mid-Atlantic region during the winter season; especially, during El Nino (warm) events. Coastal storms in the I-95 corridor absent sustained cold air would be much more likely to generate rain or snow changing to rain in the big cities along I-95.

The Arctic Oscillation signal and “high-latitude blocking”

“High-latitude blocking” is tracked by meteorologists through indices known as the Arctic Oscillation (AO) and its closely-related cousin called the North Atlantic Oscillation (NAO). The Arctic Oscillation refers to opposing atmospheric pressure patterns in middle and high latitudes. When the AO is positive, for example, surface pressure is low in the polar region and this helps the mid-latitude jet stream to blow strongly and consistently from west-to-east keeping Arctic air locked up in the polar region. When the AO index is negative, there tends to be high pressure in the polar regions (i.e., “high-latitude blocking”), weaker zonal winds, and greater movement of polar air into the middle latitudes. While the AO and NAO indices are primarily used during by forecasters during the winter season, trends in summer and fall seasons can provide important clues about the ensuing winter season.

Evidence shows that when AO reaches negative values on a consistent basis during the month of July, the subsequent winter season typically will have frequent “negative” AO periods which are correlated with “high-latitude blocking” patterns. As it turned out, the AO signal this past July averaged out to be one of the most negative in the past 50 years and every single one of the ten most negative AO index readings during the month of July featured negative AO index values during subsequent winters which would typically give the northeastern US plenty of cold air to work with. In addition, AO index trends in autumn seasons also have been shown to be useful predictors for subsequent winter seasons. Specifically, negative AO index values in October typically translate to negative values during the following winter season. In summary, the low mean AO value of this past summer negatively biases the upcoming winter AO and if the current negative AO persists for much of the fall, this too will likely increase the odds of negative AO during the winter season.
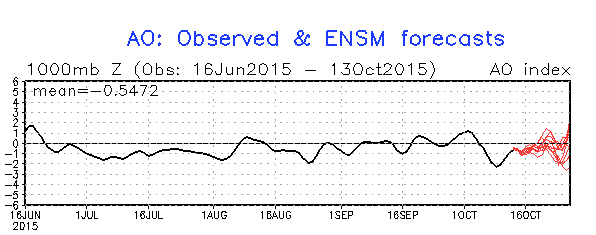
AO_10_13.gif

[Arctic Oscillation index (actual black; forecast red); courtesy NOAA]

The snowpack signal and “high-latitude blocking”

In addition to the Arctic Oscillation signal, snowpack in the northern hemisphere during the autumn season has also been found to be an important predictive factor with respect to “high-latitude blocking” patterns during subsequent winter seasons. In fact, research studies have actually pinpointed the region in Siberia below 60°N during the month of October as critical with respect to the likelihood of “high-latitude blocking” atmospheric patterns during the following winter season. If snowpack is above-normal and consistently expanding during October in that particular part of Siberia, research studies suggest there is an increased chance for more frequent “high-latitude blocking” configurations in subsequent winter months.

Indeed, the snow anomaly chart (below) shows above-normal snowfall at the end of September for the northern hemisphere although not quite at the extreme levels of a year ago. In addition, there has been a significant increase in snowpack across Siberia during the first half of October including in the region south of 60°N (white area in maps below) and I expect this trend to continue during the second half of the month. For Eurasia as a whole, the snowpack at the end of September was the 18th highest in the last 47 years and it was the 14th highest across the entire northern hemisphere (source Rutgers Snow Lab).

rutgers-snow.png

[Northern Hemisphere snow cover anomalies at end of September: http://climate.rutgers.edu/snowcover/chart_anom.php?ui_set=1&ui_region=nhland&ui_month=9]

Picture1.png

[Noticeable expansion of Siberian snow cover (in white) from 9/30 (left) to 10/13 (right); courtesy NOAA]

Low solar activity and “high-latitude blocking”

Research has shown that low solar activity tends to be correlated with frequent “high-latitude blocking” patterns and we are now experiencing one of the weakest solar cycles (#24) in more than a century. The “analog years” plot below shows surface-level height anomalies in low solar activity years (solar minimum phases) and high pressure dominates near Greenland and Iceland (orange, red). In addition to solar cycle 24 being a historically weak one, we have likely exited its solar maximum phase (indicated by arrow) - usually the most active time in a given solar cycle - and are now headed towards the next solar minimum. As a result, odds favor low solar activity during this upcoming winter season which has been found to be well correlated with frequent “high-latitude blocking” scenarios.

solar-analaog.png

[Typical surface height anomaly pattern during low solar activity time periods; courtesy NOAA/NCEP]

solar-cycle-24.gif

[Solar cycle 24 is historically weak and continues a weakening trend in recent solar cycles; source: http://solarscience.msfc.nasa.gov/images/Cycle22Cycle23Cycle24big.gif]

The bottom-line

Given the expected oceanic surface temperature patterns around the world for this winter season and the likelihood for “high-latitude blocking” events, I believe the Mid-Atlantic region from DC-to-Philly-to-New York City will experience normal to slightly above normal temperatures (0.0°C to +1.0°C); however, there will be occasional Arctic air outbreaks. As the winter season progresses, the weather should turn increasingly colder “relative-to-normal” in the Mid-Atlantic region following a mild November and likely a warmer-than-normal December.  

The overall weather pattern should be quite stormy with numerous coastal storms and above-normal snowfall in DC, Philly and New York City with the heaviest snow likely falling during the second half of the winter season. In addition, there is the chance for a blockbuster snow event or two given the expected “El Nino-enhanced” coastal storms and, if this were to occur, it would most likely happen during the latter half of winter. Look for at least 20-30 inches in the DC metro region during the upcoming winter season, 30-40 inches in Philly, and 35-45 inches in the NYC metro region.

Elsewhere, much of the northern US should feature above-normal temperatures while much of the southern half of the nation will be colder-than-normal. This would be a dramatic difference from recent winters in the Northern Plains and Upper Midwest where they have suffered through bitter cold weather conditions. Precipitation should be above-normal in California - alleviating their drought significantly - and higher-than-normal across the southern US and up along the eastern seaboard.

Extended Video Discussion

httpv://youtu.be/cvXqZljmtfA


Paul Dorian

Vencore, Inc.

Valley Forge, PA

9:30 AM | Tropics showing some life

Paul Dorian

2ndary_peak_of_tropical_season.png

[Climatological trend for Atlantic Basin hurricanes/tropical storms]

Discussion

Even though we have now just passed the climatological peak of the Atlantic hurricane season (approximately September 10th), there are reasons to believe that tropical activity can still have a direct impact on the US mainland as we head through the rest of summer and into the fall season. Sea surface temperatures generally are running at above-normal levels for this time of year in much of the Atlantic Basin and this should certainly help in the formation of late season tropical systems.

saharan_airmass.jpg

[Saharan air mass map; courtesy University of Wisconsin/CIMSS]

In fact, there are currently a couple of tropical waves in the Atlantic that are moving generally to the west. Indeed, there is actually a third wave just now coming off the African west coast and it is also headed in a general westward direction. The latest “Saharan air mass” map (courtesy University of Wisconsin/CIMSS) shows the current location of these tropical waves (circled) and it also suggests that these waves may not have to deal with much dry Saharan air in the near future (shown on map with orange, yellow and reds). This has not been the case for much of the summer in that most developing tropical systems during the past few months have encountered dry Saharan air in their path and this factor has inhibited growth in most cases. The bottom line, the warmer-than-normal sea surface temperatures combined with the lack of much in the way of dry Saharan air in the Atlantic Basin, suggests that the tropics will need to be closely monitored as we head towards the fall season.

Video

httpv://youtu.be/yU5-RNm-p_w

10:00 AM | An update on Tropical Storm Erika and the obstacles it faces

Paul Dorian

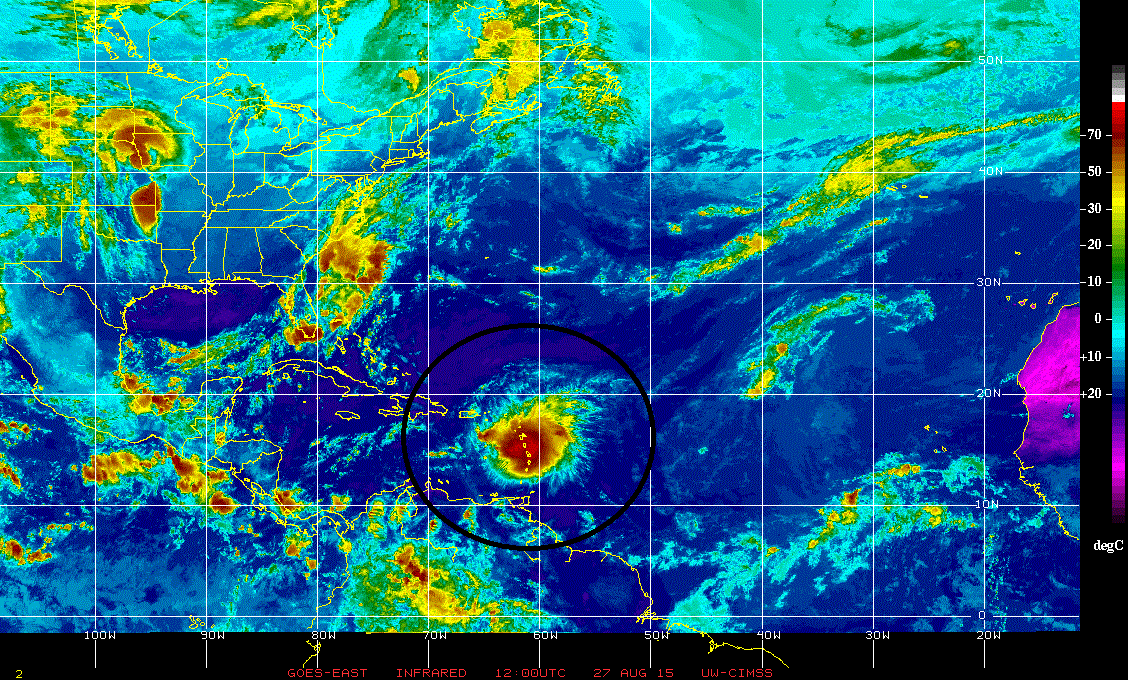
erika.gif

[Latest colorized IR satellite image of Tropical Storm Erika; courtesy University of Wisconsin/CIMSS]

Background

The US has not been hit by a major hurricane (i.e., category 3 or higher) since October of 2005 (Wilma) and, amazingly, Florida has not been struck by a hurricane of any intensity since the same time (and same storm). There is a chance that the hurricane drought in Florida ends by early next week, but it certainly is no guarantee and several factors can keep the drought alive for the state.

Overview

Tropical Storm Erika formed in the tropical Atlantic a couple of days ago and it appears to be headed on a track that will move it to the Bahama Islands by early in the weekend and then likely to a position off the east coast of Florida by Sunday or Monday. Steering currents in the upper part of the atmosphere to the south of a sub-tropical ridge of high pressure are likely to be flow out of the east or northeast during the next few days and this should push the system on a general west-to-northwest track. After that time, there are signs that the flow of air near the east coast will turn towards the north or northeast and this could actually push Erika away from the coastline – perhaps even before it ever makes landfall in the SE US.

Storm Intensity

As far as intensity is concerned, Erika has had trouble intensifying during the past 24 hours or so as its circulation centers have not been aligned properly for strengthening. Specifically, there has been a circulation center at lower levels of the atmosphere displaced from upper levels of the atmosphere and the best intensification usually occurs when there is one large vertically stacked central core to the storm.

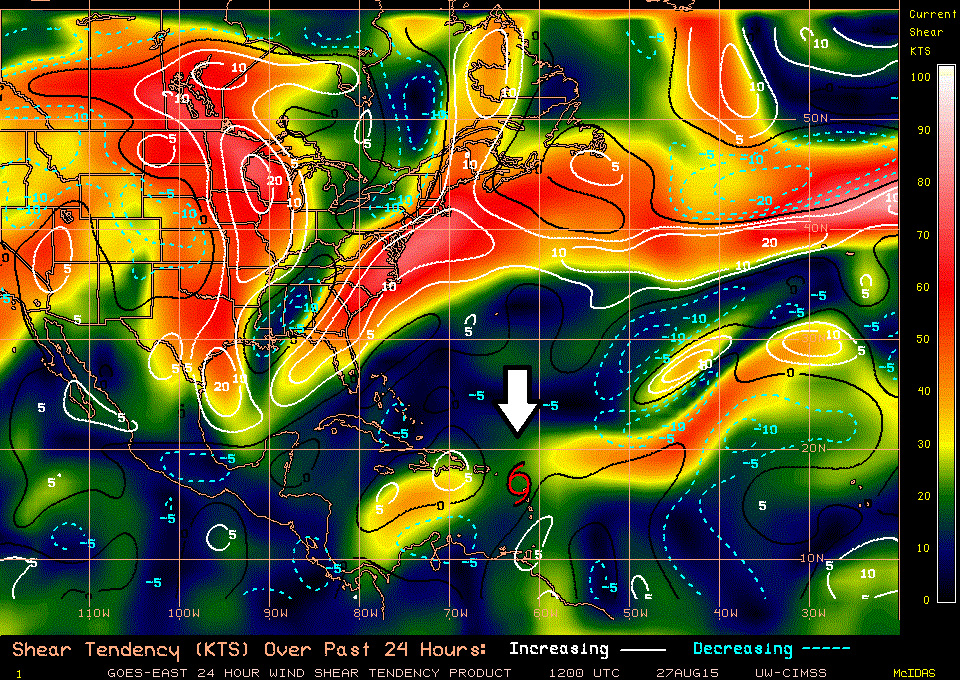
During the next two or three days, Erika will have two - and perhaps three - factors that could cause it to weaken or, at a minimum, minimize its strengthening possibilities. First, there is an area of wind shear (changing wind direction in the atmosphere) that exists around the island of Hispaniola (yellow region below; current location of Erika indicated by white arrow). Wind shear contributed to the demise of Hurricane Danny just a few days ago in the same general area and it will likely present quite an obstacle for Erika over the next 48 hours or so. Second, there is some dry air in the expected path of Erika that it will encounter in the next 48 hours or so. This dry air originated over the Saharan Desert region of Africa several days ago and - similar to the wind shear – it could contribute to some weakening of Erika. Finally, Erika’s expected general west-to-northwest track will likely take the storm very close to Hispaniola and a slight shift in the track could bring it right over the island. This island has some rather high mountains and a move by Erika over the island could very well contribute to some significant weakening.


[24-hour atmospheric shear tendency; courtesy University of Wisconsin/CIMSS]

Longer Term

After these next few days when Erika encounters some wind shear and dry air - and perhaps even takes a path over the island of Hispaniola - overall environmental conditions should become more favorable for intensification for whatever remains of Erika. However, at this time the steering currents in the the atmosphere could possibly act to push Erika away from the coastline of the Southeast US. Stay tuned…there is hope that the hurricane drought in Florida continues. [Detailed video discussion on Erika below]:

Video

httpv://youtu.be/8Lc__pNR41A

12:15 PM | The first hurricane of the Atlantic tropical season...likely headed towards Puerto Rico and Hispaniola...may reach its peak intensity during next 24 hours or so and then weaken

Paul Dorian

danny.gif

[Latest GOES satellite image of Hurricane Danny; courtesy NOAA/McIdas]

Friday 12:15 PM Discussion

Danny has become the first hurricane of the Atlantic Ocean tropical season and it has reached a strong category 2 status with sustained winds of 105 mph while moving WNW at 10 mph. This system started off earlier in the week as an “African-wave” moving from the east to the west pushed along by tropical trade winds. Danny strengthened noticeably in the overnight hours and its rather small eye has become better defined (see satellite image above).

While strengthening can continue over the next 24 hours or so – perhaps even allowing Danny to reach major hurricane category 3 status – there are signs that after that point in time some weakening is likely to take place. Currently, there is a weak trough over the western Atlantic and this should lift northward over the next couple of days allowing for a ridge to build westward and strengthen. As a result, Danny is likely to turn more westward in the near term and perhaps experience an increase in its forward speed. The current environment for Danny is that of light vertical wind shear, but as the ridge intensifies, there is likely to be increasing upper-level southwesterly flow and the overall vertical wind shear should increase after 24 hours or so. [Vertical wind shear can be defined as a change of wind direction with altitude where strong wind shear indicates significant wind direction changes in a given vertical column of air].

In addition, Danny is about to encounter an area of dry air which should inhibit its intensification along with the increasing vertical wind shear which is aided in part by El Nino conditions in the tropical Pacific Ocean. In fact, dry air from the Saharan Desert region of Africa extends all the way from the African coast to the Caribbean Sea. Danny, as indicated below by the arrow, is about to move into an area of drier air that originated over the Saharan Desert (dry Saharan air indicated by "yellows/oranges").

dust-analysis.jpg

[Saharan air analysis; courtesy NOAA/CIMSS-University of Wisconsin]

Danny is expected to reach the Leeward Islands in about 3 days (Monday), near Puerto Rico in about 4 days (Tuesday) and then near the island of Hispaniola (Haiti/Dominican Republic) in about 5 days (Wednesday). Given the likely increase in vertical wind shear and its encounter with drier air, Danny may very well drop back to "weak hurricane" or even “tropical storm” status by the time it reaches Puerto Rico and Hispaniola. Looking down the road, another wave is moving off Africa's west coast and this tropical system could ultimately become more of a threat to the US than Danny (cloud mass at lower, bottom region of "Saharan air analysis" image). Stay tuned.

11:55 AM | Typhoon Soudelor to reach "super" status

Paul Dorian

Untitled.png

[Close-up colorized IR image of Typhoon Soudelor; courtesy MTSAT]

latest_mtsat_ir2_china1.jpg

[Full disk IR image of Typhoon Soudelor; courtesy MTSAT, University of Wisconsin]

Discussion

Sea surface temperatures in the western Pacific Ocean are running at warmer-than-normal levels and this combined with low wind shear is helping to fuel the intensification of Typhoon Soudelor - the strongest storm of 2015. Soudelor is likely to intensify rapidly over the next few days to rarely seen pressure levels and places like Taiwan and eastern China are keeping a close eye on it. The latest close-up colorized IR satellite image and full disk IR image (above) feature an impressive-looking eye with a well-balanced and symmetrical appearance to the overall storm. A computer forecast model called the Hurricane Weather Research and Forecast System (HWRF) is designed by NOAA to be specifically used for hurricanes and its operational version forecasts a minimum pressure of 908 millibars in 72-hours (plot below) which is equivalent to an amazing 26.81 inches (other models shown in the plot are somewhat weaker). The very latest European computer forecast model plows the storm directly into Taiwan late this week with a central pressure of 919 millibars (27.14 inches). Even if Soudelor begins to weaken prior to possible landfall in Taiwan and eastern China, it is still expected to be a significant typhoon and preparations are already being made for the storm from Shanghai to Taipei. [Click here for a video of the "close-up" view: http://www.ssd.noaa.gov/PS/TROP/floaters/13W/imagery/rbtop_lalo-animated.gif]

HWRF_min_press_fcst_soudelor1.png

[Operational HWRF forecasts a minimum pressure of 908 millibars for Typhoon Soudelor in 72 hours; courtesy NOAA]

10:30 AM | Arctic sea ice showing great resiliency

Paul Dorian

Overview

There has been talk in the climate community over the past several years that the Arctic Ocean would be nearly ice-free by now, but sea ice in the Arctic region has actually shown great resiliency. Sea ice covers about 7% of the Earth’s surface and about 12% of the world’s oceans and forms mainly in the Earth’s polar regions (i.e., in the Northern Hemisphere’s Arctic Ocean and in the sea area around the Southern Hemisphere’s continent of Antarctica). While the Southern Hemisphere sea ice extent has been running consistently at above-normal levels in the past few years and often at record highs, the Northern Hemisphere has generally been at below-normal amounts. In this same time period; however, sea ice in the Arctic region has shown a great ability to recover which has confounded many global climate modelers and it has actually been in a general upward trend since reaching a low point in 2012 (example journal article on measured versus modeled discrepancies in sea ice data: http://www.hindawi.com/journals/amete/2015/481834/). Furthermore, in recent months the northern Atlantic Ocean has begun to show signs of a potential long-term temperature phase shift from warm-to-cold and this could very well lead to a significant further rebound in Arctic sea ice – perhaps eventually to the above-normal levels seen during the last cold phase.

SST_07_27_15.gif

[Sea surface temperature anomalies as of July 27, 2015; courtesy NOAA]

North Atlantic Sea Surface Temperature (SST) Change

The northern Atlantic Ocean switched sea surface temperature phases from cold-to-warm back in the mid 1990’s and this shift was directly correlated with the flipping of Arctic sea ice extent from above-normal to below-normal and it has generally been below-normal since that point in time. The sea surface temperature phase in the northern Atlantic Ocean is tracked by meteorologists with the Atlantic Multidecadal Oscillation (AMO) index and in recent months this number has been bouncing back-and-forth between negative (cold) and positive (warm) values suggesting a possible long-term phase change may indeed be taking place. An area of colder-than-normal sea surface temperatures (blue region in circled area) has expanded significantly in recent months across the northern Atlantic Ocean and temperatures in the Arctic region have run at normal-to-slightly below-normal levels (plot below, circled area; green line represents normal). [For more information on the possible Atlantic Ocean temperature phase shift: http://vencoreweather.com/2015/03/22/1230-pm-the-atlantic-ocean-is-showing-signs-of-a-possible-significant-long-term-shift-in-temperatures-from-warm-to-cold/].

Arctic_temperatures_for_2015_using_DNI.png

Daily mean temperature and climate north of the 80th northern parallel, as a function of the day of year. Source: Danish Meteorological Institute (DMI) – Centre for Ocean and Ice; http://ocean.dmi.dk/arctic/meant80n.uk.php

Significant improvement in Arctic sea ice extent since 2012

One of the lowest points with respect to Arctic sea ice took place in the year 2012. During that year, Arctic sea ice bottomed out during the peak of the melting season (late summer) to levels not seen before in the satellite era (since 1979). Recent reports based on satellite observations, however, indicate the Arctic sea ice recovered noticeably in 2013 increasing by almost one-third – albeit from very low levels. For the last couple of months, Arctic sea ice has been running at levels higher than those seen during the past three years – although still at below-normal levels – and it has been running safely above the low point year of 2012 (“black” line in circled area below).

Arctic-Sea-Ice-Extent-Last-5-Years.png

Source: Danish Meteorological Institute (DMI) – Centre for Ocean and Ice (sea ice extent 15% or greater)

Upward trend in Arctic sea ice volume since 2012

In addition to sea ice extent, an important climate indicator to monitor is sea ice volume as it depends on both ice thickness and extent. Arctic sea ice volume cannot currently be observed on a continuous basis as observations from satellites, submarines and field measurements are all limited in space and time. As a result, one of the best ways to estimate sea ice volume is through the usage of numerical models which utilize all available observations. One such computer model from the University of Washington is called the Pan-Arctic Ice Ocean Modeling and Assimilation System (PIOMAS, Zhang and Rothrock, 2003) and it is showing an upward trend in Arctic sea ice volume since the low point was reached in 2012 following a long downtrend (circled area below). We’ll continue to monitor changes in coming months here at VencoreWeather.com with respect to the Arctic sea ice to see if the recovery from low levels continues and we’ll also watch the overall situation in the southern hemisphere.

Arctic-Sea-Ice-Volume-Trend.png

Arctic sea ice volume from the University of Washington’s PIOMAS numerical model (Note – this model output data is updated on a monthly basis, details on the PIOMAS model are available at http://psc.apl.washington.edu/research/projects/arctic-sea-ice-volume-anomaly.

Paul Dorian

Vencore, Inc.

12:20 PM | An update on El Nino - it continues to strengthen and could end up rivaling some of the strongest events in recent history

Paul Dorian

Picture1.png

Overview

El Nino conditions developed last year in the equatorial part of the Pacific Ocean and they have intensified significantly in the past few months. In fact, it appears that this El Nino may end up rivaling in strength the strongest such events in recent history which took place in 1972-1973, 1982-1983 and 1997-1998. This type of natural phenomenon features warmer-than-normal sea surface temperatures in the tropical Pacific Ocean while its counterpart called La Nina is correlated with colder-than-normal waters. Given the fact that the Pacific Ocean is by far the world’s largest, an El Nino can have significant ramifications on weather and climate in many parts of the world; especially, one that is strengthening into a such a strong event.

In the past 60 days, warmer-than-normal sea surface temperature anomalies (orange area) have spread westward from the west coast of South America into the central equatorial Pacific Ocean. Computer forecast models are in general agreement that this strengthening trend in the El Nino will continue for the next few months perhaps then followed by some weakening at the end of the year or early in 2016. Meanwhile, as El Nino intensifies in the equatorial Pacific Ocean, colder-than-normal sea surface temperatures have expanded significantly in the northwestern part of the Pacific Ocean as well as across the northern Atlantic Ocean (not shown) and this, in many ways, is equally as impressive as to what is occurring in the tropics.

Ramifications of a strong El Nino

The tropical region of the Pacific Ocean is perhaps the most important section of any ocean across the world in terms of weather and climate and strong El Nino conditions can have the following ramifications around the globe:

1) An El Nino in the summertime typically results in below-normal activity in the tropical Atlantic Ocean as it tends to generate stronger-than-normal upper level winds which act to suppress "African-wave" storm development. So far, the Atlantic tropical season has underperformed and that overall trend should continue.

2) An El Nino in the summertime typically results in normal-to-cooler-than normal temperatures across the Midwest and Northeast US. In fact, temperatures through the halfway point of summer have been relatively close-to-normal in the Mid-Atlantic’s I-95 corridor and longer term forecasts suggests a continuation of relatively moderate conditions well into the month of August.

[Note – both items 1 and 2 are described in detail in Vencore Weather’s 2015 Tropical Outlook: http://vencoreweather.com/2015/05/05/1000-am-2015-tropical-and-mid-atlantic-summertime-outlooks/]

3) An El Nino is likely to result in more rainfall compared to normal in the Southwest US which should alleviate drought conditions in California during the next 6-12 months or so. In fact, a significant rain event pounded southern California last weekend as the remains of a Pacific Ocean tropical system – aided by El Nino conditions - pushed into that region of the country.

indexes.png

[Oceanic Nino Index (ONI) values since 2000 (red=El Nino, blue=La Nina, black=neutral); courtesy NOAA]

4) An El Nino is likely to cause a spike in global temperatures. The table (above) lists the monthly “Oceanic Nino Index” since the year 2000 with El Nino events in red and La Nina conditions in blue. The last two El Nino events were rather moderate by comparison to the current one and both resulted in a short-term spike in global temperatures.

In the plot below, global temperature anomalies shown back to the year 2005 are in a jagged, but generally downward trend (data courtesy Ryan Maue, WeatherBell Analytics, Inc.). The circled areas (below) show the global temperature spikes associated with the most recent two El Nino events that occurred in 2006-2007 and 2009-2010. An important finding also revealed by this plot is that each of these two "El-Nino-induced" spikes was followed quickly by a sharp drop in global temperatures once the El Nino conditions subsided - and it is quite likely that the same thing will occur following this current El Nino.

Picture2.png

[Global temperature anomalies from 2005 through today using NOAA's CFSR/CVSv2 data; data courtesy Ryan Maue at WeatherBell Analytics, weatherbell.com]

12:00 PM | Possible early clues for another snowy and cold winter in the Northeast US

Paul Dorian

JAMSTEC-forecast.gif

Overview

The summer is just days old, but it is never too early to look for clues regarding possible weather conditions for the upcoming winter season. In reality, the long descent towards winter 2015-2016 has just begun as far as the sun is concerned with daylight hours now entering its gradual diminishing phase in this part of the world. There are, in fact, two regions in the all-important Pacific Ocean that may be providing us with signs as to what kind of weather we can expect here in the Northeast U.S. during the upcoming winter season.

One region is in the equatorial Pacific Ocean where El Niño conditions are currently quite concentrated near the northwest coast of South America. These warmer-than-normal sea surface temperatures, however, actually stretch in a general west-to-east fashion along the equator from the northwest coast of South America to the central Pacific Ocean (indicated below by arrow). Another area of interest lies across the northern Pacific Ocean where a couplet of warm and cold sea surface temperature (SST) anomalies currently exists (circled area). These two regions in the Pacific Ocean may very well be indications that we’re headed for another snowy and cold winter in the Northeast U.S.

anomnight_6_22_2015.gif

[Recent SST global anomaly map; courtesy NOAA]

JAMSTEC SST anomaly forecast for the upcoming winter season

There are many reasons to believe that the current El Niño in the tropical Pacific Ocean will not only last into the latter part of 2015, but will actually strengthen throughout the summer months before most likely beginning a weakening phase near the end of 2015 or early in 2016 (for more info on this unfolding El Niño: http://vencoreweather.com/2015/05/14/915-am-strengthening-el-nino-in-the-tropical-pacific-ocean-to-have-global-ramifications/). Not only is the strength of an El Niño an important factor in terms of its potential impact on Northeast U.S. winter weather, but its location is critical as well. A reliable computer forecast model from Japan’s Agency for Marine Earth Science and Technology (JAMSTEC) predicts El Niño will shift from near the west coast of South America to the central Pacific Ocean by next winter (indicated below by arrow). This particular location for an El Niño in the central tropical Pacific Ocean has been correlated with snowy winters in the Northeast U.S. – most recently during the winters of 2002-2003 and 2009-2010.

JAMSTEC-forecast.gif

[JAMSTEC predicted SST anomalies for winter 2015-2016; courtesy Japan’s Agency for Marine Earth Science and Technology]

In addition, the JAMSTEC SST anomaly prediction for next winter suggests there will be a continuation of the current couplet of warmer and colder-than-normal water in the northern Pacific Ocean (circled area above). The warmer-than-normal water south of the Alaska coastline has, in fact, persisted relentlessly for the past couple of years and has contributed to colder-than normal weather here in the Northeast US during the last couple of winters.

Consequences of the predicted SST anomaly pattern in the Pacific Ocean

During winter seasons, the sea surface temperature anomaly couplet in the northern Pacific Ocean generally has led to a persistent upper-level ridge of high pressure along the west coast of the US and Canada and an upper-level low in the north-central Pacific Ocean – usually an atmospheric combination that promotes colder-than-normal weather around here by allowing for the transport of Arctic air from northern Canada into the northern US. Meanwhile, an El Niño focused in the central Pacific Ocean often has been correlated with above-normal snowfall in the Northeast U.S. – most recently during the winters of 2003-2003 and 2009-2010. One of the possible reasons for this outcome is that warmer-than-normal sea surface temperatures in the tropical Pacific Ocean during wintertime tend to produce abundant moisture levels in the southern branch of the upper-level jet stream which is often a key player in Northeast U.S snowstorms.

Comparison with two snowy winters (2002-2003, 2009-2010)

Some rather amazing similarities exist between the JAMSTEC forecasted sea surface temperature anomalies for the upcoming winter season and the actual anomalies that took place during the snowy winters of 2002-2003 and 2009-2010. Not only do they both feature "centrally-based" El Niño’s in the tropical Pacific Ocean (indicated below by arrow), but they both have a noticeable SST couplet with a warm anomaly pattern tucked in near the Alaska coastline and a colder-than-normal region just to its southwest (circled area).

actual-SSTs.png

[Actual SST anomaly pattern during the winter seasons of 2002-2003, 2009-2010; courtesy NOAA]

What could change this preliminary snowy and cold winter outlook?

One way meteorologists track the strength of an El Niño is through an “oceanic Niño” index value. The latest 3-month running average of this index has risen from 0.2 in August/September/October of last year to 0.7 in March/April/May in this year. Generally, if this index rises above 2.0, the El Niño is considered to be in the “super strong” category. The last time a “super strong” El Niño actually took place was during 1997-1998, but there are some important differences between today's overall setup in the tropical Pacific Ocean and the situation back in the late 1990s. Specifically, there is a ring of warm water today surrounding much of the Australian continent and this usually has an inhibiting effect on the strength and longevity of an El Nino. If, however, a super strong El Niño were to develop by next winter across the central and eastern tropical Pacific Ocean, then this could very well flood much of the country including the Northeast U.S. with warmer-than-normal weather conditions. While I do expect this El Niño to become fairly strong – perhaps in the 1.5–2.0 index value range – I don't think it’ll rise to “super strong” levels seen last in the 1997-1998 time period and I also believe it’ll be focused in the central part of the tropical Pacific Ocean by next winter.

Concluding remarks

We’ll continue to monitor both the strength and location of the strengthening El Niño in the tropical Pacific Ocean over the next few months here at “vencoreweather.com”. As of right now, there are reasons to believe that there will be a centrally-based, moderately-strong El Niño as we head into the winter months of 2015-2016 along with a couplet of warm and cold anomaly water in the northern Pacific Ocean – all of which could lead to another snow-filled and cold winter in the Northeast U.S.

Paul Dorian

Vencore, Inc.

9:15 AM | Strengthening El Nino in the tropical Pacific Ocean to have global ramifications

Paul Dorian

SST-Anom-changes.png

Discussion

Overview

El Nino conditions began to develop last year in the equatorial tropical Pacific Ocean and all indications suggest rapid strengthening is now taking place. This type of natural phenomenon features warmer-than-normal sea surface temperatures in the tropical Pacific Ocean with its counterpart, La Nina, associated with colder-than-normal waters. Given the fact that the Pacific is by far the world’s largest ocean, an El Nino in its equatorial region can have significant ramifications on weather and climate in many parts of the world; especially, one that is strengthening rapidly and sustained.

In the past 30 days, sea surface temperature anomalies have changed noticeably off the west coast of South America as rapid warming has taken place (orange area in comparison map above). Computer forecast models are in general agreement that this strengthening trend will continue for the next few months perhaps followed by weakening in the overall El Nino later this year.

Ramifications of a strengthening El Nino

The tropical Pacific Ocean is perhaps the most important part of any ocean across the world and strengthening El Nino conditions can have the following ramifications around the globe:

1) An El Nino during the summertime typically results in below-normal activity in the tropical Atlantic Ocean as it tends to generate stronger-than-normal upper level winds which act to suppress "African-wave" storm development.

2) An El Nino during the summertime typically results in normal-to-cooler-than normal temperatures across the Midwest and Northeast US.

[Note – both items 1 and 2 are described in detail in Vencore Weather’s 2015 Tropical Outlook: http://vencoreweather.com/2015/05/05/1000-am-2015-tropical-and-mid-atlantic-summertime-outlooks/]

3) An El Nino is likely to result in more rainfall compared to normal in the Southwest US which could alleviate drought conditions in California during the next 6-12 months or so.

Nino_index_values_2005-20151.png

[Oceanic Nino Index (ONI) values for past 10 years (red=El Nino, blue=La Nina, black=neutral); courtesy NOAA]

4) Finally, an El Nino is likely to cause a spike in global temperatures. The table above lists the monthly “Oceanic Nino Index” for the past 10 years and there have been two El Nino episodes (arrow regions) in which an (red) index value of 1.0 was reached (moderate strength): "late 2006" and "late 2009 into early 2010". While I do not believe this El Nino will develop to "super" strong levels (i.e., index values of 2.5 or higher), I do believe it will strengthen to strong levels (i.e., 1.5 to 1.9) during the next few months from its current reading of 0.6 before weakening likely begins late in the year or early in 2016.

While there has been a jagged, and generally downward trend in global temperatures during the past 10 years according to NOAA's CFSR/CVSv2 data, in those months associated with these two El Nino episodes global temperatures actually spiked. The circled areas in the plot below show the “El Nino-induced” spikes in global temperatures associated with the "late 2006" and "late 2009/early 2010" moderate-strength El Nino events (data courtesy Ryan Maue at Weather Bell Analytics, NOAA). In addition, an important point to note is that in both of these El Nino events, global temperatures actually dropped sharply shortly after El Nino conditions subsided (circled regions).

global_temps_2005_thru_31DEC2014_with_El_Nino_spikes.png

[Global temperature anomalies from 2005 through 2014 using NOAA's CFSR/CVSv2 data; courtesy Ryan Maue at Weather Bell Analytics, weatherbell.com]

10:00 AM | 2015 Tropical and Mid-Atlantic Summertime Outlooks

Paul Dorian

Discussion

Overall Summary

The overall numbers are likely to be down this year in terms of the number of Atlantic Basin tropical storms, but the sea surface temperature pattern in the western Atlantic and Gulf of Mexico makes the U.S. east coast vulnerable to “home-grown” tropical hits. The major factors involved with this year’s tropical outlook include a strengthening El Nino in the central equatorial Pacific, colder-than-normal waters off of the west coast of Africa, and pockets of warmer-than-normal temperatures in the Gulf of Mexico and also just off the US east coast. As a result, there are likely to be fewer-than-normal “African-wave” type tropical systems that travel long distances across the tropical Atlantic this season and more in the way of “home-grown” type systems that develop much closer to the U.S. Typically, the “African-wave” type storm plays an important role during the peak months of the tropical season (August and September) while “home-grown” systems can be important early and late in a given tropical season.

In a normal Atlantic Basin tropical season, there are about 12 named storms with 6 or 7 reaching hurricane status and only 2 or 3 actually reaching major status (i.e., category 3, 4 or 5). This year there may be more on the order of 8-10 named storms with 3-5 reaching hurricane status, but despite these expected slightly below-normal overall numbers, the U.S. could actually see more tropical activity than normal due to the sea surface temperature pattern in the western Atlantic and Gulf of Mexico.

One final note of interest, amazingly and fortunately, the US mainland has not been struck by a major hurricane (i.e. category 3 or higher) since Hurricane Wilma in October 2005. Although the landfall record gets muddy before the early 20th century, this is the first time since hurricane record-keeping began in 1851 that the United States has gone so long without at least a category 3 landfall. The previous streak was eight years, from 1861 to 1868.

El Nino in the tropical Pacific Ocean

What goes on in the tropical Pacific Ocean does indeed have an effect on the tropical Atlantic Ocean. El Nino, which refers to warmer-than-normal waters in the equatorial Pacific Ocean, affects global weather patterns and it tends to produce faster-than-usual high-altitude winds over the tropical Atlantic Ocean. This increase in the upper atmospheric winds over the tropical Atlantic Ocean is usually an inhibiting factor for tropical storm formation in the Atlantic Basin as it tends to “rip apart” developing storms. Currently, there are numerous signs for strengthening of the current El Nino in the tropical Pacific Ocean over the next few months and this should inhibit storm formation in the tropical Atlantic Ocean. Specifically, numerous computer forecast models support the idea that the current relatively weak equatorial El Nino strengthens this summer into moderately-strong status.

El-Nino-forecasts.gif

[Computer model forecasts of El Nino; courtesy IRI, Columbia University, NOAA]

SST1.gif

Atlantic Ocean, Gulf of Mexico sea surface temperature patterns

The main breeding grounds for Atlantic Ocean tropical systems are in the region between the west coast of Africa to the Caribbean Sea and the Gulf of Mexico. Above normal sea surface temperatures in this region generally help to intensify tropical waves that come off of the west coast of Africa and move westward in the trade winds. Similar to last year, there is a pocket of colder-than-normal sea surface temperatures off the west coast of Africa and this should inhibit the formation of tropical storms in that part of the tropical Atlantic Ocean. On the other hand, there are warmer-than-normal pockets of water just off the U.S. east coast and across much of the Gulf of Mexico, and these anomalous regions should aid in the development of “home-grown” type storms in nearby locations such as the Caribbean Sea, Gulf of Mexico or just off the Southeast U.S. coastline. [Sea surface temperature anomaly pattern (orange, yellow = warmer-than-normal; courtesy NOAA]

Mid-Atlantic Summer Outlook

I believe there is little chance for a hot, dry summer in the Mid-Atlantic region and the most likely scenario is for near normal rainfall amounts with a slight leaning towards the cool side of normal when it comes to temperatures in the June, July, August time period The strengthening of El Nino in the tropical Pacific Ocean will play a role in our summertime weather pattern which usually leads to cooler-than-normal conditions, and there are two other factors that should turn out to be meaningful. First, the record-breaking Great Lakes ice cover extent during the past winter season is generally a useful predictor of cooler-than-normal temperatures in the Mid-Atlantic region during the subsequent summer season. In fact, Great Lakes ice cover extent as of late April was 27% - the highest ever so late in the season – and there was still more than 5% coverage in early May across Lake Superior. This finding of generally cooler-than-normal summers in the Mid-Atlantic region following high ice cover winters in the Great Lakes region is not necessarily because of the actual ice cover, but rather due to the overall - and likely still on-going - weather pattern that created the anomalous ice cover in the first place and typically persists beyond the winter season. In addition, soil moisture content is relatively normal around here in the Mid-Atlantic region as we head into the month of May thanks to the snowy winter and recent spring rains. Normal-to-high soil moisture content tends to significantly reduce chances for summertime drought and excessive heat.

Paul Dorian

Vencore, Inc.

Extended Video Discussion

httpv://youtu.be/x8QZ3wxVGJM