9:30 AM | *Winter-like pattern to resume after "spring break"*
Paul Dorian
Discussion
Overview This break in our recent cold and stormy weather pattern will continue to provide us with glimpses of spring-like warmth over the next 7 days or so, but the signs for a return to a winter-like pattern in the Northeast US are rather convincing. There are numerous signals that point to a period of colder-than-normal weather in the Northeast US for the last third of March and the beginning third of April (roughly March 18-April 10) and it is quite likely to include more threats of snow. These signals that suggest there will be a return to a winter-like pattern are described below and involve such things as the Madden Julian Oscillation, stratospheric warming, 500 millibar height anomalies, and the Arctic Oscillation index.
Madden Julian Oscillation (MJO) The MJO is a tropical disturbance that propagates eastward around the global tropics with a cycle on the order of 30-60 days. It is a large-scale coupling between atmospheric circulation and tropical deep convection. The MJO has wide ranging impacts on the patterns of tropical and extratropical precipitation, atmospheric circulation, and surface temperature around the global tropics and subtropics. Furthermore, the MJO influences both precipitation and surface temperature patterns across the US. Specifically, one significant impact of the MJO in the U.S. during the northern hemisphere winter is an increase in the frequency and intensity of cold air outbreaks across the central and eastern US.
 [European model forecast of the MJO index through March 23rd; courtesy NOAA]
MJO Phases Research has found that the location of the MJO, or phase, is linked with certain temperature and precipitation patterns around the world. The MJO phase diagram (above) illustrates the recent and forecasted progression of the MJO index through different phases which generally coincide with locations along the equator around the globe. When the index is within the center circle, the MJO is considered weak, meaning it is difficult to discern. Outside of this circle, the index is stronger and will usually move in a counter-clockwise direction as the MJO moves from west to east. The very latest European computer forecast model predicts an increasingly strong MJO index that will propagate through “phase 6” into “phase 7” on its way to “phase 8” over the next few weeks (follow green line in figure above in a counter-clockwise fashion). Phases 7 and 8 for the MJO index for this time of year (i.e., March/April/May) typically signal colder-than-normal temperatures in the northeastern U.S. (see circled “blue” regions below in "phases 7 and 8" temperature anomaly charts).
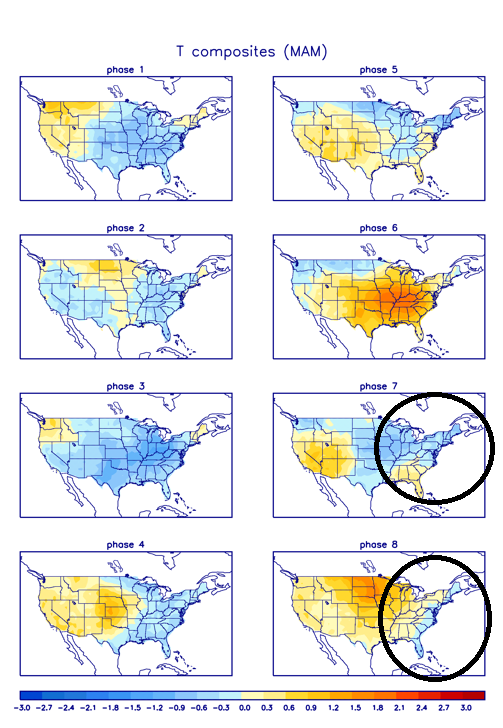 [US temperature anomalies for different phases of the MJO index during the period of March/April/May; courtesy NOAA]
Sudden Stratospheric Warming (SSW) Another way to monitor the potential for Arctic air outbreaks in the northeastern U.S. is to follow what is happening in the stratosphere over the polar region of the northern hemisphere. Sudden stratospheric warming (SSW) events in the region of the North Pole have been found to set off a chain of events in the atmosphere that ultimately lead to Arctic air outbreaks from central Canada into the northeastern U.S. Indeed, there is reason to believe that there will be a significant stratospheric warming event during the next couple of weeks over the North Pole that could contribute to a return of our colder-than-normal temperature pattern in the northeastern U.S. as we progress through the latter part of March and into the month of April. The current stratospheric temperature pattern (at 10 millibars) and the 10-day forecast are shown below and they show an impressive area of stratospheric warming closing in on the North Pole later this month with the typical "polar-based" cold vortex getting displaced towards Asia.
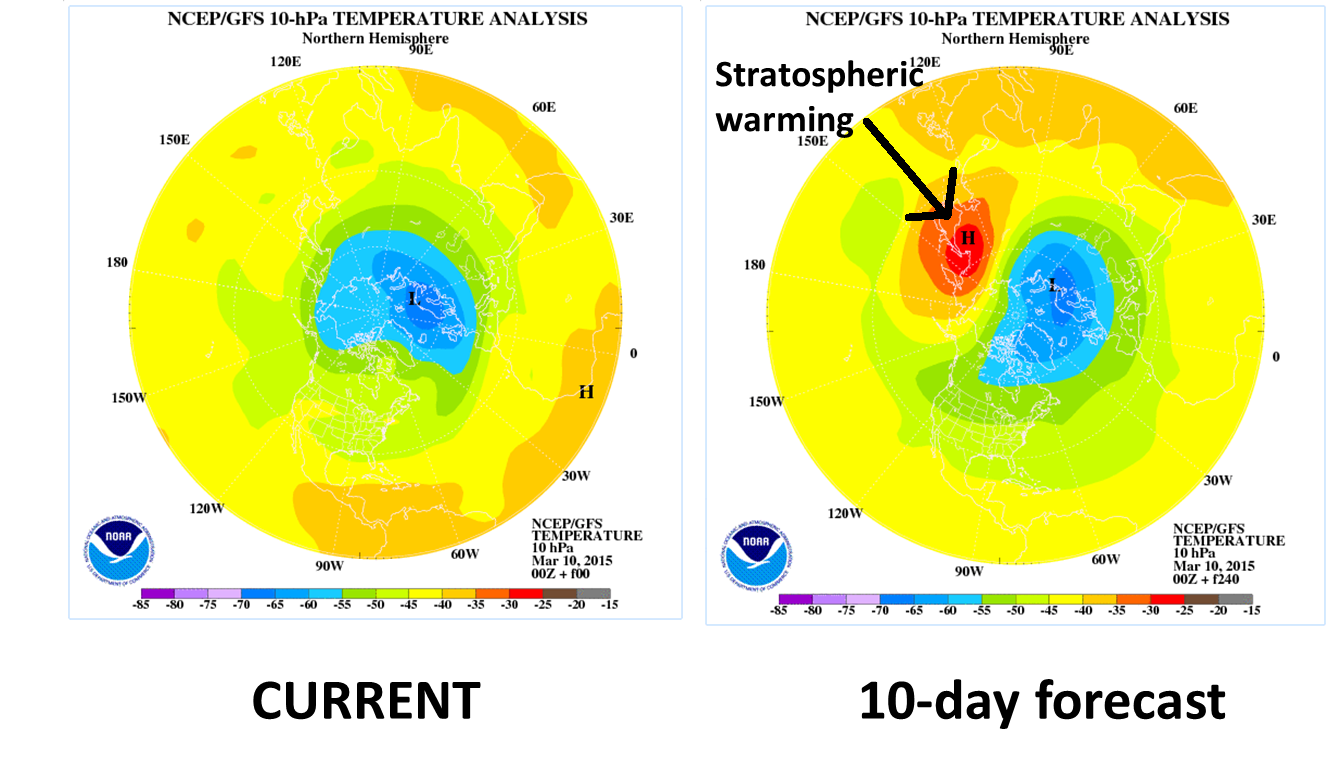 [Temperature analysis at 10 millibars (stratosphere), current and 10-day forecast; courtesy NOAA]
500 millibar height anomalies The 500 millibar height anomaly forecast (below) for 10 days from now from the 06Z GFS Ensemble run indicates strong ridging (oranges) will re-develop in western Canada at the same time troughs of low pressure (blue) will form in the northeastern US and in the North Pacific region just to the south of Alaska. This type of upper air pattern usually leads to multiple Arctic air mass incursions into the northern US from northern Canada and, in fact, was in place for much of this winter season. This forecast map also suggests that the upper-level winds at 500 millibars – which tend to follow the height anomaly lines - could actually bring air directly from the North Pole into the northeastern US by the latter part of March. In addition, there are signs for “blocking” high pressure to form near Greenland at this same time period (oranges) and that tends to help keep cold air sustained in the northeastern US for a lengthy period of time.
 [06Z GFS Ensemble 500 mb height anomaly forecast map for March 20th; map courtesy "tropicaltidbits.com", NOAA]
Arctic Oscillation index High-latitude blocking can be tracked by meteorologists through indices known as the Arctic Oscillation (AO) and its closely-related cousin called the North Atlantic Oscillation (NAO). When the AO is positive, for example, surface pressure is low in the polar region and this helps the mid-latitude jet stream to blow strongly and consistently from west-to-east keeping Arctic air locked up in the polar region. When the AO index is negative, there tends to be high pressure in the polar regions (i.e., “high-latitude blocking”), weaker zonal winds, and greater movement of polar air into the middle latitudes. The forecast of the AO index (red line on plot below) suggests there will be a plunge from the current strongly positive value to well into negative territory by later this month which supports the theory that cold air will be sustained in the northeastern US as an upper-level blocking pattern develops.
 [Observed (black) and forecast (red) of the Arctic Oscillation index; courtesy NOAA]
Paul Dorian Vencore, Inc.