1:00 PM | Stratospheric warming event may signal colder pattern ahead
Paul Dorian
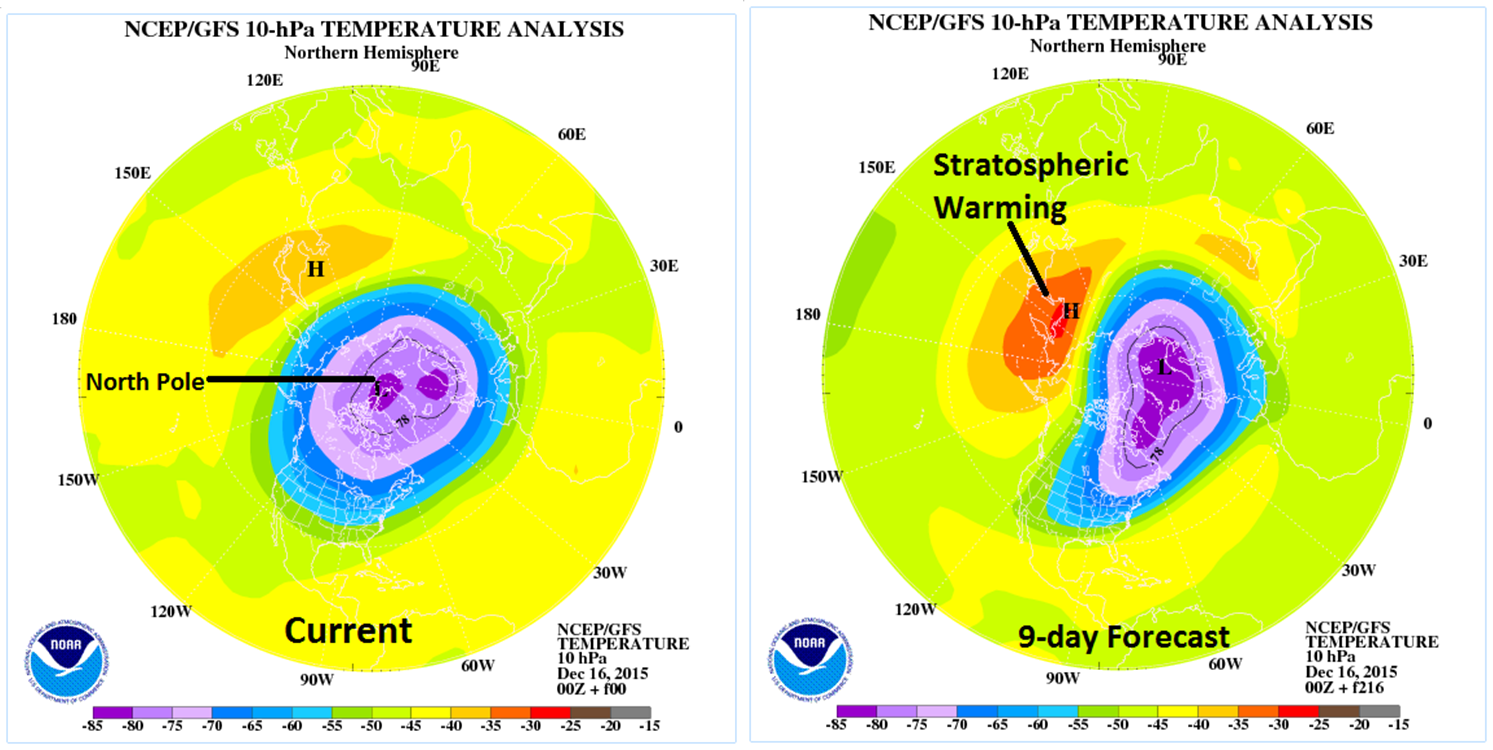
Polar view of current stratospheric (10-millibars) temperature pattern and the 9-day forecast using the 00Z GFS computer forecast model; courtesy NOAA
Overview
One of the ways to monitor the potential for Arctic air outbreaks in the northern U.S. is to follow what is happening in the stratosphere over the polar region of the northern hemisphere. Sudden stratospheric warming (SSW) events are large, rapid temperature rises in the winter polar stratosphere occurring primarily in the Northern Hemisphere. They have been found to often set off a chain of events in the atmosphere that ultimately leads to Arctic air outbreaks from northern Canada into the central and eastern U.S. Indeed, there appears to be a stratospheric warming event in the offing over the next week to ten days (above) centered near the North Pole that provides some reason to believe that the current warm temperature pattern in the eastern US could change during the month of January.
Stratospheric warming
During the winter months in the lower polar stratosphere, temperatures are typically lower than minus 70° Celsius (purple area above). The cold temperatures are combined with strong westerly winds that form the southern boundary of the stratospheric polar vortex. The polar vortex plays a major role in determining how much Arctic air spills southward toward the mid-latitudes. This dominant structure is sometimes disrupted in some winters or even reversed. Under these circumstances, the temperatures in the lower stratosphere can rise by more than 50°K in just a few days. This sets off a reversal in the west-to-east winds and the collapse of the polar vortex. In response to the stratospheric warming at the high latitudes, the troposphere in turn cools down dramatically and this cold air displacement is then transported from the tropospheric high latitudes to the tropospheric middle latitudes. The entire process from the initial warming of the stratospheric at high latitudes to the cooling in the troposphere at middle latitudes can take weeks to unfold.
Comparison to last year’s stratospheric temperatures
The plot (below) shows the stratospheric (10-millibar) temperature pattern for 2014 and 2015 in the high latitude region of 90°N to 65°N. Interestingly, last winter season featured a sharp spike in stratospheric temperatures at just about this same time of year (i.e., mid-to-late December as indicated by the arrow below) and the following couple of months were indeed quite cold in the central and eastern US. Some stratospheric warming events in recent decades have, in fact, been followed by widespread very cold air outbreaks across southern Canada and the US some two to three weeks after the initial upper atmosphere warming. For example, such an event occurred during December 1984 and this led to an extremely cold January 1985 in much of the central and eastern US. A detailed video discussion on “Stratospheric Warming” can be found on the “Meteorology 101” page of the Vencore weather web site. We’ll continue to closely monitor temperature changes in the stratosphere over the North Pole during the next few weeks to see how this warming event unfolds.
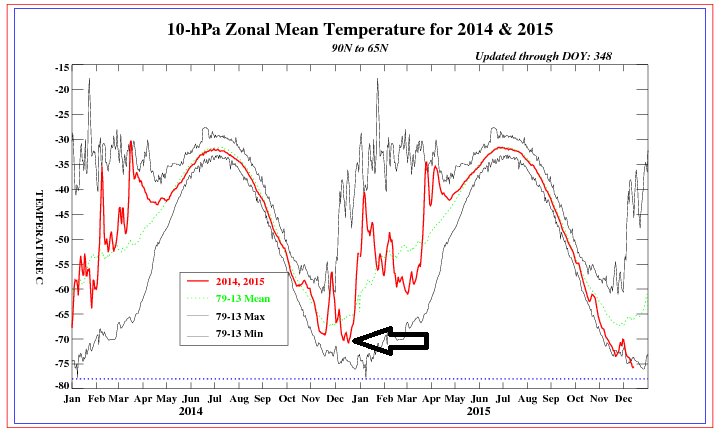
Stratospheric (10-millibars) temperature plot for 2014 and 2015 in high latitude region of 90°N to 65°N; courtesy NOAA
Meteorologist Paul Dorian
Vencore, Inc.