9:10 AM | *El Nino struggles to get going*
Paul Dorian

Sea surface temperature anomalies since early January show El Nino (warmer-than-normal) conditions off the west coast of South America; courtesy NOAA/CPC
Overview
Just when it looked like El Nino was getting ready to overspread the tropical Pacific Ocean with warmer-than-normal sea surface temperatures something somewhat unexpected has taken place. While still above normal, sea surface temperatures have actually dropped quite noticeably in recent days in the equatorial region of the Pacific Ocean near the west coast of South America. Computer forecast models still are generally quite supportive of the idea of a strengthening El Nino going into the middle and latter parts of the year, but recent observations certainly have to raise some questions about those predictions.
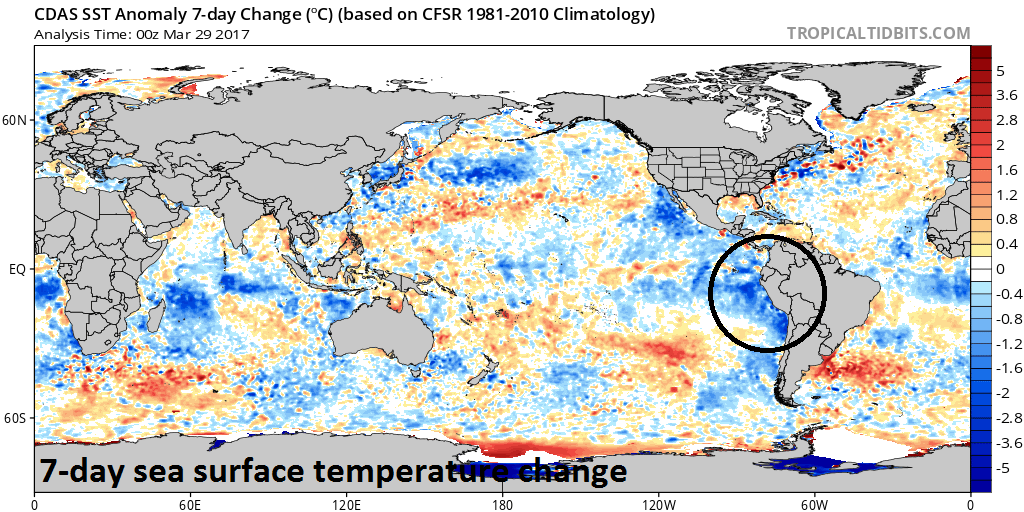
Sea surface temperature changes over the past 7 days with noticeable cooling in El Nino region; map courtesy tropicaltidbits.com, NOAA
SST changes
In the last 7 days, sea surface temperatures have actually dropped pretty noticeably just off the west coast of South America which is the same area where El Nino burst onto the scene earlier in the year. This may just be a temporary blip or part of an important trend and will be closely monitored. One of the reasons it is necessary to closely follow the changes in the tropical Pacific Ocean is the fact that it can have an important consequence on the rapidly approaching Atlantic Basin (i.e., Atlantic Ocean, Caribbean Sea, Gulf of Mexico) tropical season. In an El Nino year, for example, there is a tendency for a less active tropical season in the Atlantic Basin as wind shear is typically higher-than-normal and this tends to inhibit the growth of tropical storms.
Southern Oscillation Index (SOI)
In addition to the short term sea surface temperature changes in the tropical Pacific Ocean, the Southern Oscillation Index (SOI) for the last 30 days is sending some unfavorable signals regarding the formation and intensification prospects for El Nino. The SOI gives an indication of the development and intensity of El Niño or La Niña events in the Pacific Ocean. The SOI is calculated using the pressure differences between Tahiti and Darwin. Sustained negative values of the SOI lower than −7 often indicate El Niño episodes. These negative values are usually accompanied by sustained warming of the central and eastern tropical Pacific Ocean, a decrease in the strength of the Pacific Trade Winds, and a reduction in winter and spring rainfall over much of eastern Australia and the Top End.
Sustained positive values of the SOI greater than +7 are typical of a La Niña episode. They are associated with stronger Pacific trade winds and warmer sea temperatures to the north of Australia. Waters in the central and eastern tropical Pacific Ocean become cooler during this time. Together these give an increased probability that eastern and northern Australia will be wetter than normal.
In general, recent readings of the SOI do not support the idea for a strengthening El Nino in the tropical Pacific. In fact, instead of sustained negative values which is indicative of El Nino episodes, the SOI has actually averaged +4.47 in the last 30 days and +1.05 in the last 90 days (data source).

Compilation of model forecast for ENSO; courtesy IRI/CPC
Computer forecast models
The most recent forecasts made in Mid-March by a series of dynamical and statistical models for sea surface temperatures in the Nino 3.4 region continue to overwhelmingly support the idea of an increasingly strong El Nino throughout 2017. Any positive value shown on the plot of model forecast sea surface temperature anomalies is indicating El Nino conditions for the tropical Pacific Ocean. The yellow line represents an average of all models which hovers around the 1°C temperature anomaly line though much of the second half of the year and this would result in a moderate strength El Nino.

Model forecasts are for El Nino region 3.4 (boxed in region) in the equatorial Pacific Ocean
Meteorologist Paul Dorian
Vencore, Inc.
vencoreweather.com