
7:00 AM | *A slowdown in the normal springtime melting of Arctic sea ice*
Paul Dorian
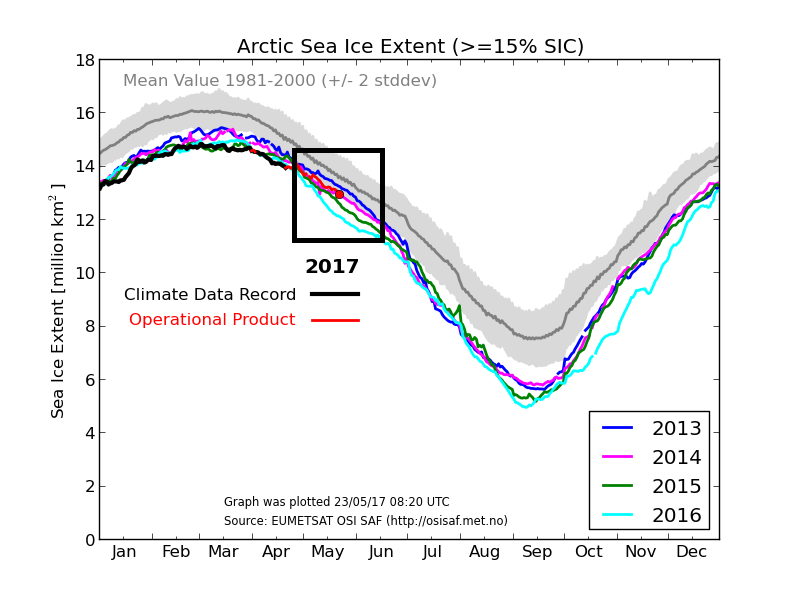
Arctic sea ice extent for 2017 with red circle representing current amount; courtesy EUMETSAT
Overview
This could very well be just a temporary blip, but Arctic sea ice extent has actually crossed into territory in recent days that it hasn’t seen too often in many months. Specifically, Arctic sea ice extent as measured by the European global operational satellite agency (EUMETSAT) has moved into the relatively “normal” range of +/- 2 standard deviations – albeit on the very low side of “normal” for this particular time of year. Arctic temperatures have dropped to below-normal levels in recent weeks after running consistently above-normal for the first four months of the year and this has slowed down the normal springtime melting in that region.

Arctic, Greenland, and Northern Hemisphere sea ice extent
The normal spring melting of Arctic sea ice has slowed in recent weeks as temperatures have dropped to below-normal levels. The current Arctic sea ice extent (red circle) as measured by EUMETSAT Ocean and Sea Ice Satellite Application Facility (OSI SAF) is above those levels seen during the last two years at this particular time of year and is very close to levels seen in 2014. Earlier this year, the Arctic sea ice extent was running at levels below all years in recent history.

Northern Hemisphere sea ice extent since March 1st; courtesy NOAA
Elsewhere across the northern hemisphere, Greenland has been running at near record high levels for ice and snow extent during the past several months and it is still gaining overall - though that upward trajectory is likely to end within a few weeks. The sea ice extent for the entire northern hemisphere has actually moved to slightly above the 10-year average (dashed line) as reported by the NOAA’s National Ice Center.

Arctic temperatures for 2017 compared to normal for base period of 1958-2002; courtesy Danish Meteorological Institute
Arctic temperatures
There has been a pretty consistent temperature pattern across the Arctic in recent years featuring warmer-than-normal conditions during the cold season (roughly nine months of the year), and near normal conditions during the warm season (roughly three months). This repeating temperature pattern in the Arctic during the past few years has likely helped to prevent any kind of massive meltdown from happening – as feared by many– since the warm season is the only time of year from a climatological viewpoint that mean temperatures are above the freezing level (273K, blue line). Near normal temperatures during the warm season are quite unlikely to allow for such a dramatic loss of sea ice in the Arctic region.

Consistent temperature pattern in the Arctic region during the last three years with near normal conditions in the all-important warm season with respect to sea ice extent and above-normal conditions in the cold season; data courtesy Danish Meteorological Institute
This year has started the same way as recent years with daily mean temperatures north of the 80th northern parallel running consistently at above-normal levels for the first four months of the year. However, in recent weeks, Arctic temperatures as measured by the Danish Meteorological Institute (DMI) have slipped to below-normal levels. With this most recent swing of Arctic temperatures into below-normal territory, it looks increasingly unlikely that there will be any kind of massive meltdown this summer season. The daily mean temperatures in the Arctic region are calculated from by using data from Europe’s main computer forecast model (ECMWF) and the base period for comparison of 1958 to 2002 (shown in green) comes from a reanalysis data set from the same forecast model.

Observed AMO index, defined as detrended 10-year low-pass filtered annual mean area-averaged SST anomalies over the North Atlantic basin (0N-65N, 80W-0E), using HadISST dataset (Rayner, et al., 2003) for the period 1870-2015.; courtesy NCAR
Atlantic Multidecadal Oscillation
The Arctic sea ice extent has been generally below normal since the middle 1990’s at which time the northern Atlantic Ocean switched sea surface temperature phases from cold-to-warm. Meteorologists track oceanic temperature cycles in the northern Atlantic Ocean with an index value known as the Atlantic Multidecadal Oscillation (AMO). The AMO flipped from negative-to-positive in the mid 1990's signaling an important long-term sea surface temperature phase shift from cold-to-warm and it has stayed generally positive ever since. Typically, oceanic temperature cycles in the Atlantic Ocean have lasted for about 20 to 30 years and we may be getting close to the next long-term phase shift. Stay tuned.
Meteorologist Paul Dorian
Vencore, Inc.
vencoreweather.com