7:15 AM | *Signs of a resurgence in La Nina and the potential implications on global temperatures and the upcoming winter season*
Paul Dorian
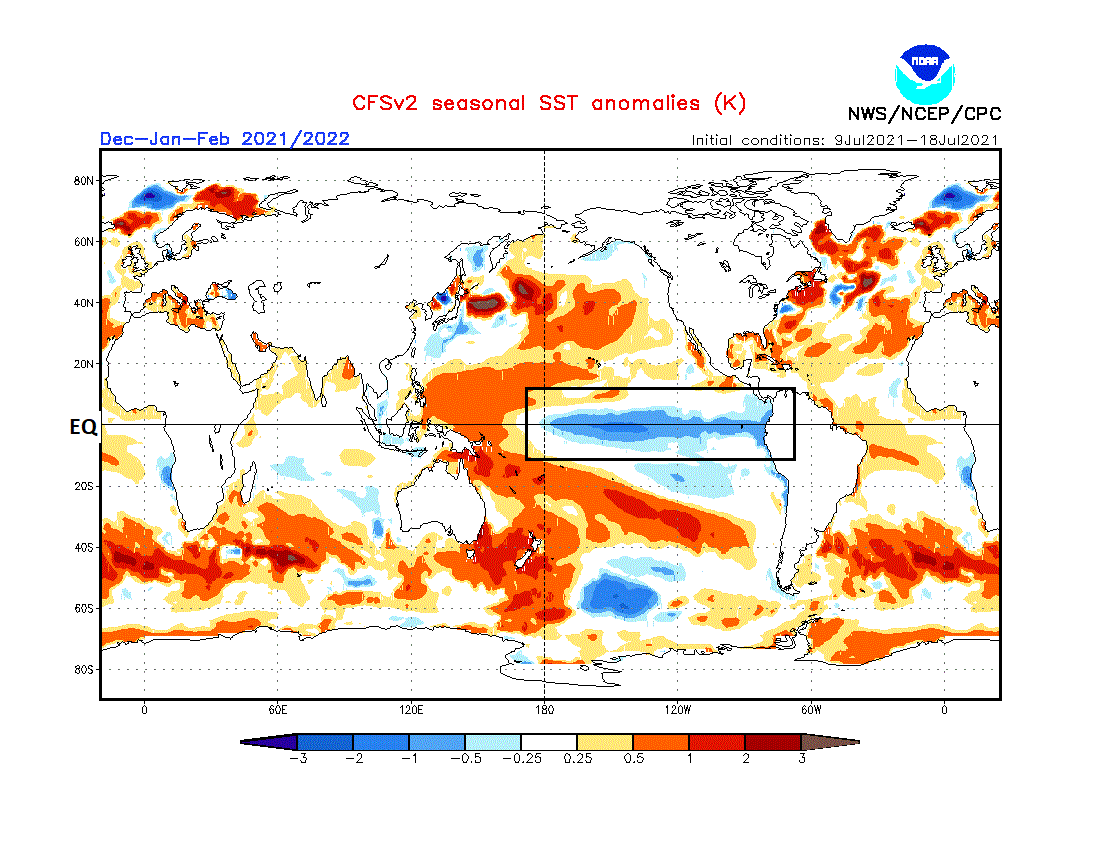
NOAA climate model known as the CFSv2 is predicting a La Nina event (boxed region) for the upcoming winter season of 2021-2022. Source NOAA/CPC
Overview
La Nina conditions (cooler-than-normal water) developed early last year in the equatorial part of the Pacific Ocean and then intensified some during the past winter season. In the first several months of this year, water temperatures in the tropical Pacific Ocean have trended towards neutral, but there are signs of a resurgence in La Nina as we head towards autumn. In fact, there are signs right now that suggest the resurgence may already be underway in the central Pacific Ocean. The return of La Nina could have implications on global temperatures and also on the upcoming winter season of 2021-2022.
Warm (red, none shown) and cold (blue) periods in this table are based on a threshold of +/- 0.5oC for the Oceanic Niño Index (ONI) [3 month running mean of ERSST.v5 SST anomalies in the Niño 3.4 region (5oN-5oS, 120o-170oW)], based on centered 30-year base periods updated every 5 years. La Nina conditions developed in the spring of 2020 and continued into the spring of this year, but has been trending towards neutral in recent months. Data source: NOAA/CPC
The Pacific Ocean and signs of a resurgence in La Nina
The Pacific Ocean is the largest on the planet, covers more than 30 percent of the Earth’s surface, and is bigger than the landmass of all the continents combined. The warm waters of the equatorial Pacific Ocean store a great amount of latent heat compared to cooler waters and breed a great deal of convection which impact downstream ridging and troughing in the atmosphere. As such, its sea surface temperature (SST) pattern has a tremendous influence on all weather and climate around the world and the more anomalous the sea surface temperatures, the more the impact can be on the atmosphere around the world. The El Nino-Southern Oscillation (ENSO) is a recurring climate pattern involving changes in the temperature of waters in the central and eastern tropical Pacific Ocean. El Nino warmer-than-normal water) and La Nina (colder-than-normal water) are the extreme phases of the ENSO cycle; between these two phases is a third phase called ENSO-neutral.
The plot shows forecasts made by dynamical and statistical models for sea surface temperatures (SST) anomalies in the “Nino 3.4” region for nine overlapping 3-month periods. Many of the models suggest the current nearly neutral conditions transition into a resurgent La Nina episode as we into the upcoming fall and winter seasons. Data source: IRI/CPC
Several independently-made computer forecast models support the idea of a change in the central part of the tropical Pacific Ocean by the fall of 2021 from the current near neutral conditions to one featuring La Nina once again. The plume of El Nino Southern Oscillation (ENSO) model forecasts (see plot) generated in mid-June indicate a resurgence of La Nina conditions is likely to take place by later this summer and continue through autumn. Indeed, some models (e.g., NOAA’s CFS v2) are predicting La Nina will last right into the winter of 2021-2022 with sea surface temperatures as much as 1.0°C below-normal in the "Nino 3.4" region (i.e., central tropical Pacific Ocean) during December/January/February.
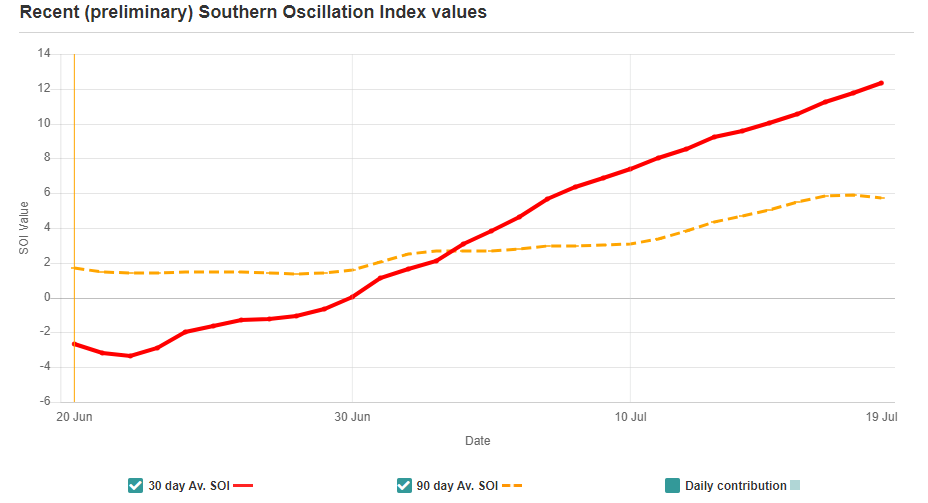
The trend of the Southern Oscillation Index (SOI) is up for the last 30 days signaling that a resurgence of La Nina may already be underway in the central Pacific Ocean. Source: The Queensland Government (Australia), The Long Paddock
Teleconnection indices are suggesting a resurgence in La Nina conditions across the equatorial Pacific Ocean may already be underway. Specifically, these types of indices can be tracked to provide information on pressure patterns across the Atlantic and Pacific Oceans which, in turn, can directly impact winds and sea surface temperatures. Specifically, the magnitudes of these indices which can be in positive or negative territory can provide clues about upcoming wind changes and sea surface temperature patterns. Two closely-related teleconnection indices that provide clues about the North Atlantic Ocean are known as the North Atlantic Oscillation (NAO) and Arctic Oscillation (AO).
For the Pacific Ocean, there is a metric known as the Southern Oscillation Index (SOI) which is directly correlated with the pressure differences between Tahiti and Darwin. This index can signal changes in wind flow and sea surface temperature patterns providing us with clues on the potential development and/or intensification of El Nino or La Nina. Sustained negative values of the SOI lower than −7 often indicate El Nino episodes are underway. These negative values are usually accompanied by a decrease in the strength of the Pacific Trade Winds and sustained warming of the central and eastern tropical Pacific Ocean. Sustained positive values of the SOI greater than +7 are typical of a La Nina with waters in the central and eastern tropical Pacific Ocean becoming cooler during this time. In recent days, the SOI has increased noticeably while in positive territory – perhaps a significant early sign of a resurgent La Nina.
In general, an El Nino episode in the tropical Pacific Ocean tends to cause a spike in global temperatures and there is often a noticeable drop off with La Nina as has occurred during the past several months. Data source: Dr. Roy Spencer, University of Alabama at Huntsville (UAH)
Impact on global temperatures
What goes on in the Pacific Ocean in terms of sea surface temperatures (i.e., El Nino, La Nina) can indeed have an impact around the world with respect to global temperatures in the lower part of the atmosphere. In recent years, the number of El Nino episodes have surpassed the number of La Nina events and global temperatures have often reacted with noticeable spikes. For example, temperatures spiked in 2016/2017 following a strong El Nino event and they had a secondary peak in 2019 associated with a second El Nino episode in the tropical Pacific. Prior to that, strong El Nino events that centered on the years of 1997/1998, 2009/2010 and 2015/2016 were associated with sharp upticks in lower atmosphere global temperatures. In times of La Nina such as during 2007/2008 and 2010/2011, there have been noticeable downturns in global temperatures of the lower atmosphere.
Since the most recent El Nino incident of 2018/2019, La Nina has taken control and global temperatures have responded accordingly. In fact, there has been quite a noticeable drop in global temperatures over the past several months to the point that levels are nearly normal on a worldwide basis as of the latest reading in June 2021. If La Nina does indeed have a resurgence later this year, global temperatures could respond by holding at nearly normal levels or perhaps even falling to below-normal levels.
In a typical La Nina winter, there is a strong polar jet across Canada and the US and colder-than-normal conditions from Alaska to the Northern Plains. In addition, La Nina winters are often warmer and drier than normal in much of the western and southern US. As a word of caution, there are other factors that can play important roles in winter weather across the nation including sea surface temperature patterns across the North Atlantic Ocean and also stratospheric temperatures at high latitudes. Source: NOAA/NCEI
Potential impact on the upcoming winter season
In terms of the upcoming winter season of 2021-2022, La Nina could be an important factor depending on its magnitude, longevity and specific location. Typically, this type of oceanic sea surface temperature pattern leads to a strong polar jet across Canada and the US and colder-than-normal conditions from Alaska to the Northern Plains. In addition, La Nina winters are often warmer and drier than normal in much of the western and southern US. One word of caution, however, is that while the Pacific Ocean sea surface temperatures are potentially very important in terms of impact on winter weather across the US, other factors play a role as well. For example, sea surface temperatures pattern in the North Atlantic are often critical; especially, across the central and eastern US and even stratospheric temperature anomalies in high latitudes can play a crucial role.
The winter of 2020-2021 can be characterized as a “La Nina type” of season, bit the temperature anomalies (left) were rather atypical with warmer-than-normal conditions across the Northern Plains and colder-than-normal in the south-central states. Precipitation anomalies (right) has some likeness of a “typical” La Nina winter with generally drier-than-normal conditions in California, Texas and Florida. Source: NOAA/NCEI
Last winter can be safely characterized as a “La Nina” winter season and some of the “typical” results actually did take place in terms of precipitation anomalies. However, the temperature pattern across the US turned out to be somewhat “flipped” from the typical La Nina winter. Specifically, there were drier-than-normal conditions last winter from Florida-to-Texas-to-California as is typical, but temperatures were actually above-normal in the Northern Plains and below-normal in the south-central US – contrary to the usual La Nina pattern.
In the Mid-Atlantic region, any impact on snowfall in the Mid-Atlantic region from La Nina last winter was very dependent on location. While snowfall was well above-normal in most areas to the north of the PA/MD border such as the northern and western suburbs of Philly and New York City, it was generally below-normal south of the Mason-Dixon Line including in and around the Washington, D.C. metro region.
Meteorologist Paul Dorian
Peraton
peratonweather.com


![Warm (red, none shown) and cold (blue) periods in this table are based on a threshold of +/- 0.5oC for the Oceanic Niño Index (ONI) [3 month running mean of ERSST.v5 SST anomalies in the Niño 3.4 region (5oN-5oS, 120o-170oW)], based on centered 30-year base periods updated every 5 years. La Nina conditions developed in the spring of 2020 and continued into the spring of this year, but has been trending towards neutral in recent months. Data source: NOAA/CPC](https://images.squarespace-cdn.com/content/v1/56530521e4b0c307d59bbe97/1626712380288-SKM2UZWVH440XEODG15Q/2_ENSO_index_table.PNG)


