7:15 AM | *Arctic sea ice showing some resiliency in recent years...summertime (melting season) Arctic temperatures very likely to again run at nearly normal levels*
Paul Dorian

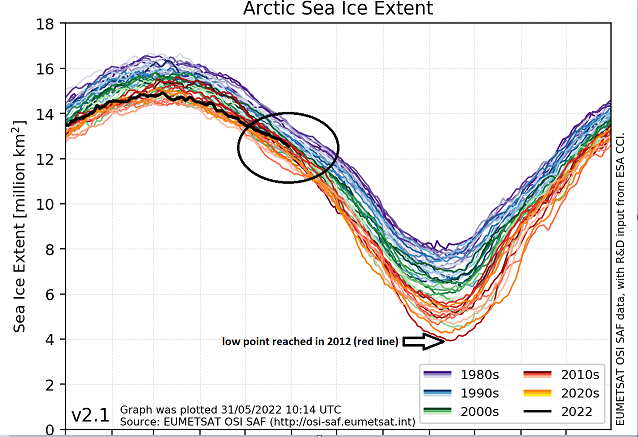
Arctic sea ice extent is running at levels that are roughly in the middle of the pack since the 1980’s as measured by satellite observations. Plot courtesy EUMETSAT OSI SAF
Overview
Arctic sea ice extent has been running at below-normal levels since the middle 1990’s at which time there was a shift in the Atlantic Multidecadal Oscillation to one featuring warmer-than-normal sea surface temperatures in the North Atlantic Ocean. The Arctic sea ice extent headed downward after that shift and reached its lowest point about ten years ago in 2012. Since then, the Arctic sea ice has shown some resiliency and is actually not all that far from normal for this time of year.
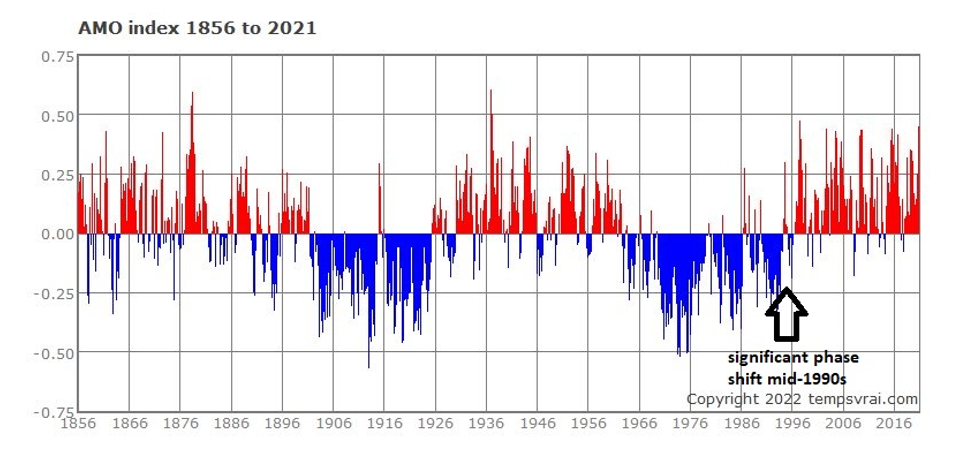
There are long-term oceanic cycles that feature different sea surface temperature patterns. The Atlantic Multidecadal Oscillation or AMO can be used to track the water temperature patterns in the northern part of the Atlantic Ocean. There was a significant phase shift in the middle 1990s with North Atlantic Ocean temperatures generally running at warmer-than-normal levels since that particular time period and this has been associated with below-normal Arctic sea ice extent.
Arctic sea ice extent
There are long-term sea surface temperature trends in the oceans around the world and the Atlantic Multidecadal Oscillation (AMO) helps track patterns in the North Atlantic. This index flipped in the middle 1990’s from a negative phase (i.e., colder-than-normal sea surface temperatures) to a positive one and Arctic sea ice extent trended downward for nearly the next two decades. In fact, one of the lowest points with respect to Arctic sea ice extent took place in the late summer of 2012 which is the usual peak of the melting season. At this time, Arctic sea ice extent reached low levels not seen before in the satellite era going back to the late 1970’s.

The melting season in the Arctic region is the summer season and temperatures have been running nearly normal for the past many years in June, July and August. In fact, while temperatures have often run at above-normal levels during the cold seasons, the summer temperatures have been nearly normal for the past couple of decades. These yearly plots going back to 2017 show the daily mean temperature north of the 80th northern parallel as a function of the day of year. The red lines represent actual observations and the green lines show the average values using the baseline period of 1958-2002. Data plots courtesy Danish Meteorological Institute (DMI)
In recent years, however, the sea ice has held its own and summertime melting seasons have generally featured nearly normal temperatures in the Arctic region. In fact, while the cold season has often featured warmer-than-normal temperatures, the trend of nearly normal temperatures in the summer months across the Arctic has been taking place for much of the past couple of decades. The timing of this is important since the summer is the ice melting season in the Arctic region and as long as temperatures remain nearly normal during this period, the chances of Arctic sea ice disappearing completely – as feared by some - will be greatly diminished. The latest observations from satellite observations (EUMETSAT) show Arctic sea ice extent is actually in roughly the middle of the pack for late May in the extended period from the 1980’s to the present.
One possible explanation of the behavior of temperatures in the Arctic region during the past many years has to do with water vapor in the atmosphere. Overall water vapor content has been higher-than-normal in the Arctic region during the past couple of decades largely as the result of warmer-than-normal sea surface temperatures in both the North Atlantic and the Pacific Ocean (multiple El Nino events). Given the warmer-than-normal water temperatures, there has been increased evaporation and this, in turn, generates more water vapor in the atmosphere. An increase in water vapor can have a much bigger impact on temperatures in cold, dry atmospheric conditions and less of an impact in more humid, warmer surroundings. As a result, an increase in water vapor in the Arctic region during the past couple of decades could very well result in warmer-than-normal temperatures during the winter and spring months when it is typically cold and dry and it can have little, if any, impact during the warmer, more humid summer (melting) season.
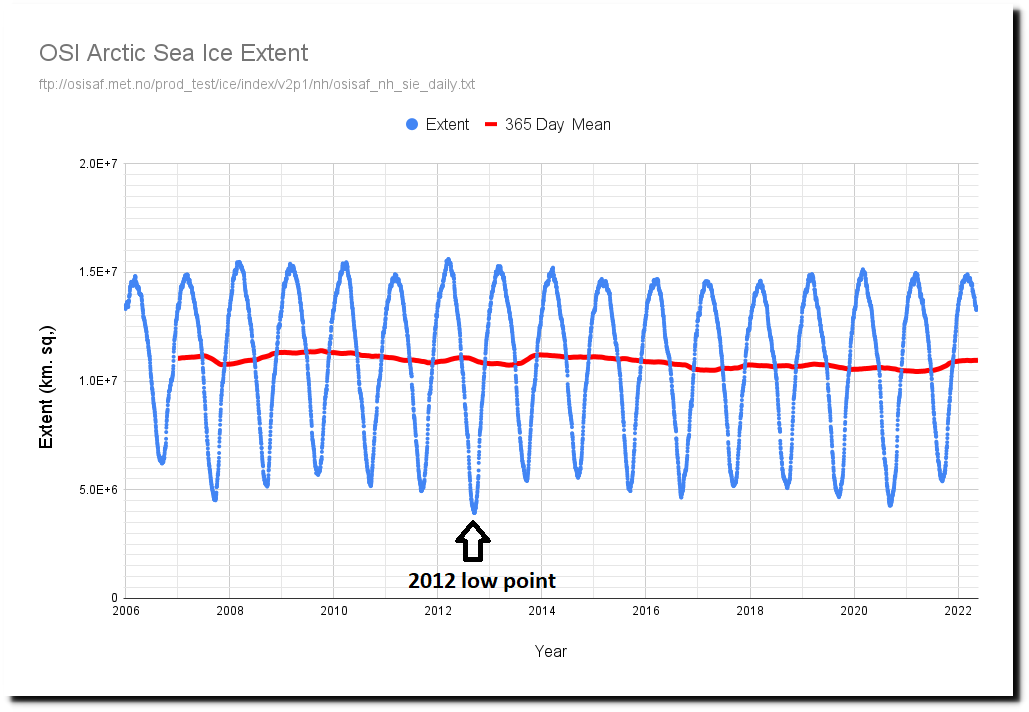
Arctic sea ice extent reached a low point at the height of the melting season in 2012 (indicated by arrow) and has been in an overall sideways trend in recent years.
A general sideways trend in Arctic sea ice volume since 2012
In addition to sea ice extent, an important climate indicator to monitor is sea ice volume as it depends on both ice thickness and extent. Arctic sea ice volume cannot currently be observed on a continuous basis as observations from satellites, submarines and field measurements are all limited in space and time. As a result, one of the best ways to estimate sea ice volume is through the usage of numerical models which utilize all available observations.
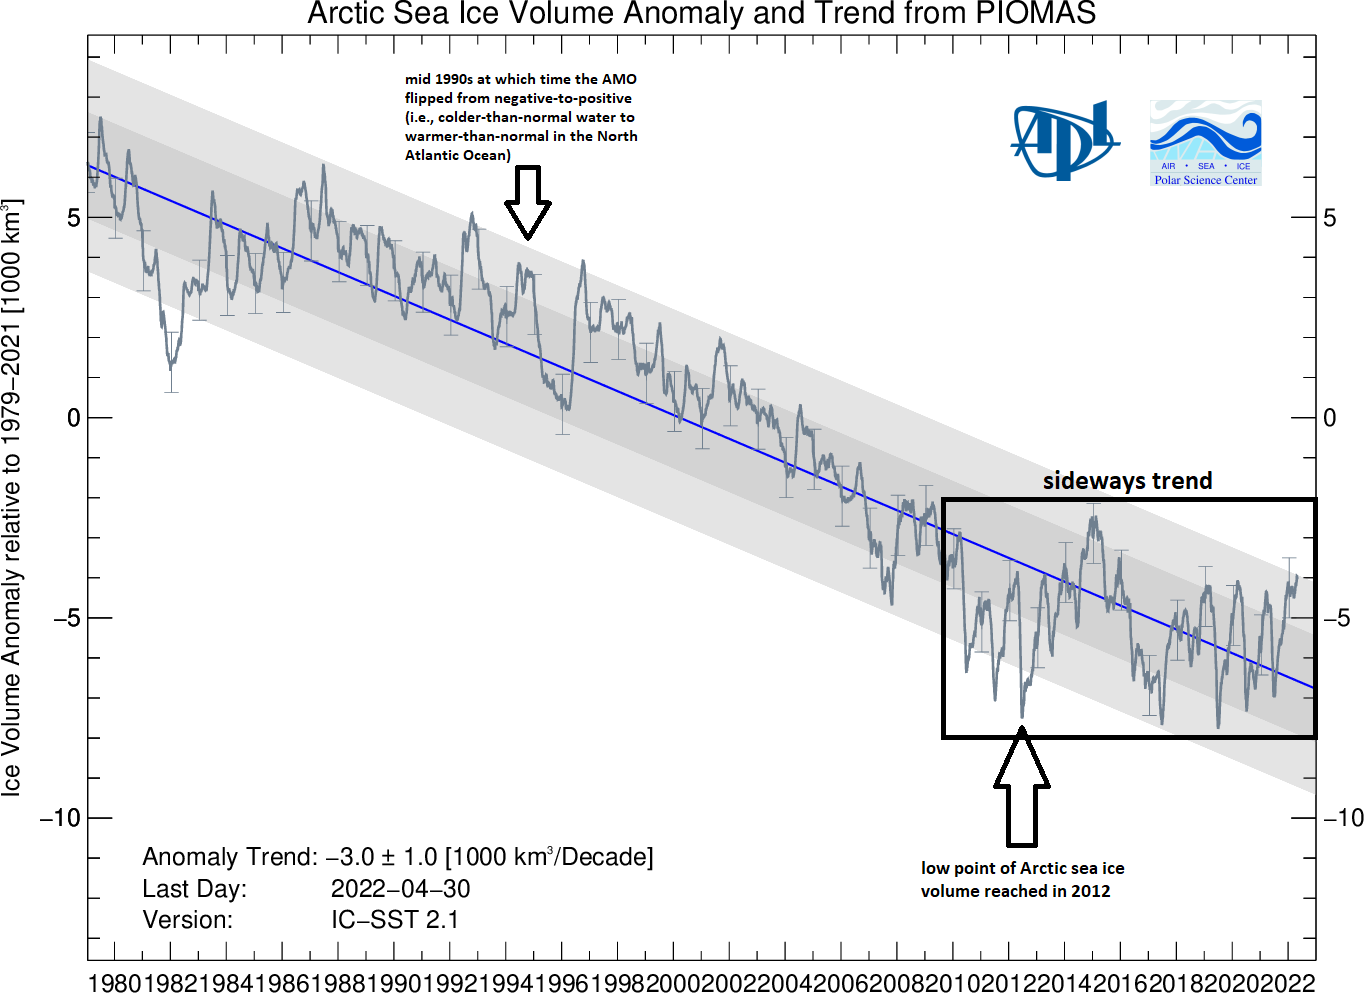
Arctic sea ice volume from the University of Washington’s PIOMAS numerical model (Note – this model output data is updated on a monthly basis, details on the PIOMAS model are available here.
One such computer model comes from the University of Washington and is called the Pan-Arctic Ice Ocean Modeling and Assimilation System (PIOMAS, Zhang and Rothrock, 2003). This model derived Arctic sea ice volume shows a downward trend from the middle 1990s to the low point that was reached in 2012. Since then, the trend of Arctic sea ice volume has generally been in a sideways fashion and we’ll continue to monitor this in coming months and years.
Meteorologist Paul Dorian
Arcfield
arcfieldweather.com