
"2025-2026 Winter Outlook" by Arcfield Weather
Paul Dorian

Weak La Nina conditions are likely to transition to neutral during this upcoming winter season in the equatorial Pacific Ocean. Typically, La Nina winters feature an active polar (northern) jet across Canada and much of the northern US and colder-than-normal conditions from Alaska to the Northern Plains. In addition, La Nina winters are often warmer and drier than normal in much of the region from southern California-to-Florida with persistent high pressure ridging in the southeastern states. Map courtesy NOAA
Overview
Numerous factors have been considered in the preparation of the “2025-2026 Winter Outlook” including the likelihood of another winter season with La Nina conditions across the equatorial Pacific Ocean. In fact, La Nina has been the dominant player in the tropical Pacific during four of the five winters this decade with colder-than-normal sea surface temperatures persisting during these seasons. While La Nina is likely as we head into the winter, it should be relatively weak and may transition into “neutral” territory during the second half of the season. As such, teleconnection indices related to other parts of the world have been closely analyzed including the Quasi-Biennial Oscillation (QBO), Arctic Oscillation (AO), and North Atlantic Oscillation (NAO) as they may play a bigger role than normal in overall winter weather patterns. The trend in these teleconnection indices can provide us with some clues as to the temperature and pressure patterns that can be expected during the upcoming winter season and to the prospects for “high-latitude blocking” events to take place. The combination of all these factors and a look at “analog” years with similar sea surface temperature and QBO patterns to today leads me to believe that this will be a colder-than-normal winter season across much of the eastern two/thirds of the nation including the Mid-Atlantic region with nearly normal to slightly above normal snowfall amounts on the table.
Key factors
There are several factors listed below that were used in the preparation of the “2025-2026 Winter Outlook”:
1. Weak La Nina conditions in the equatorial Pacific Ocean as we head into the 2025-2026 winter season which may transition into “neutral” territory during the second half.
2. Warmer-than-normal SSTs across much of the northern Pacific Ocean
3. Mixed prospects for “High-Latitude Blocking (HLB)”
a. AO/NAO autumnal trends (AO: neutral signal for HLB; NAO: favorable signal for HLB)
b. High solar activity (unfavorable signal for HLB)
c. Early season snow cover (favorable signal for HLB)
4. Teleconnection index trends/forecast of QBO
a. an “easterly” or “negative” phase of the QBO favors an increase in “sudden stratospheric warming” events and polar vortex disruptions; especially, when combined with La Nina
5. An analysis of several “analog” years suggests colder-than-normal conditions in much of the eastern two/thirds of the nation and nearly normal precipitation amounts in many areas.
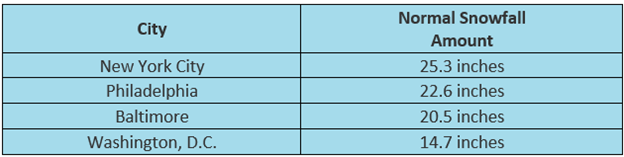
Normal Seasonal Snowfall for the DC-to-Philly-to-NYC Corridor
Importance of the Pacific Ocean
The Pacific Ocean is the largest on the planet, covers more than 30 percent of the Earth’s surface, and is bigger than the landmass of all the continents combined. The warm waters of the equatorial Pacific Ocean store a great amount of latent heat when compared to cooler waters and breed a great deal of convection which impacts downstream ridging and troughing in the atmosphere. As such, its sea surface temperature (SST) pattern has a tremendous influence on all weather and climate around the world and the more anomalous the sea surface temperatures, the more the impact can be on the atmosphere around the world. The El Nino-Southern Oscillation (ENSO) is a recurring climate pattern involving changes in the temperature of waters in the central and eastern tropical Pacific Ocean. El Nino and La Nina are the extreme phases of the ENSO cycle; between these two phases is a third phase called ENSO-neutral.
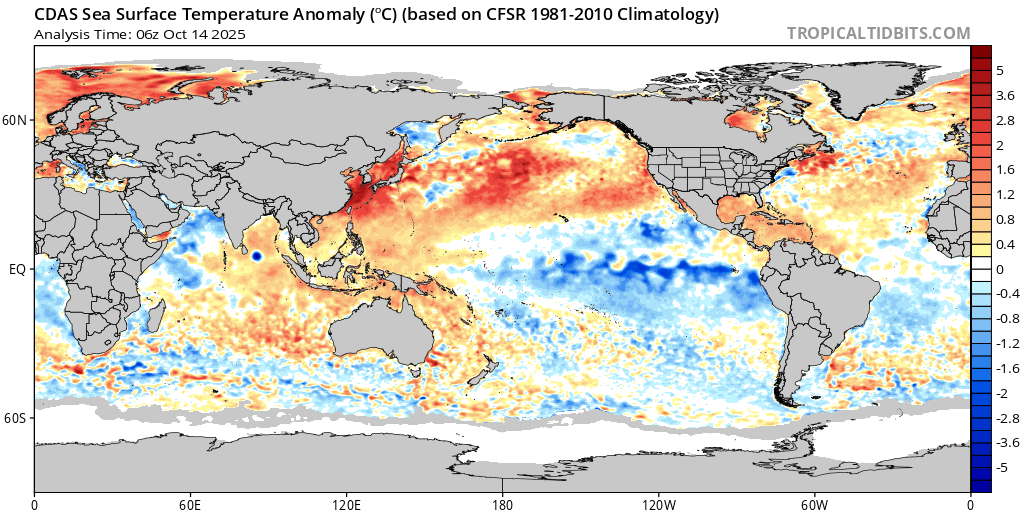
Colder-than-normal water temperatures (La Nina, shown in blue) across the equatorial part of the Pacific Ocean dominate the scene as we head towards the winter season of 2025-2026. Elsewhere, much of the northern Pacific Ocean and tropical Atlantic Ocean feature warmer-than-normal conditions (shown in orange). Plot courtesy NOAA, tropicaltidbits.com
Another winter with La Nina
Last winter featured La Nina conditions in the equatorial part of the Pacific Ocean and they have dominated for much of this decade with four out of the five seasons featuring colder-than-normal sea surface temperatures. As we progress through the fall season, weak La Nina conditions continue to persist in the tropical Pacific and numerous computer forecast models (both dynamical and statistical) support the idea for this pattern to continue as we head into the winter season of 2025-2026. Specifically, a compilation of computer forecast models suggest sea surface temperatures are likely to drop to about half a degree (°C) below normal in the central Pacific Ocean (region known as “Nino 3.4”) as we progress through the late fall and into the winter season.
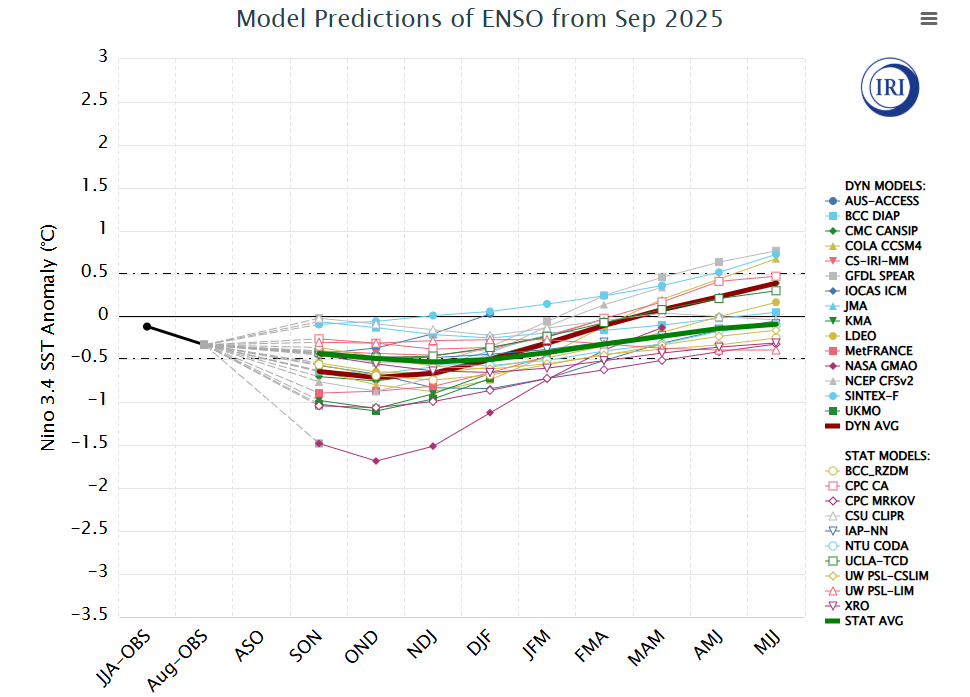
Rolling 3-month averages of sea surface temperature anomalies for the central Pacific as generated by a series of dynamical and statistical computer forecast models. The compilation of model forecasts issued during September 2025 suggests a weak La Nina is in the offing as we begin the 2025-2026 winter season, and it may transition into “neutral” conditions during the second half. Data courtesy International Research Institute for Climate and Society
Typically, La Nina winters feature a more active polar jet stream that helps to transport cold air masses from northwestern Canada/Alaska into the Northern Plains while, at the same time, much of the southern US often experiences warmer and drier conditions with high pressure ridging centered over the southeastern US. La Nina winters are somewhat random in the Mid-Atlantic region with respect to temperatures and precipitation with some years featuring more snow than normal and others less. Many of the computer forecast models suggest weak La Nina conditions may transition into “ENSO-neutral” territory during the latter half of the winter season with water temperatures in the central Pacific getting back to normal levels from slightly colder-than-normal. One other notable feature as we head towards the winter season is the large area of markedly warmer-than-normal water seen across much of the northern Pacific Ocean. This kind of water temperature pattern is likely to persist into the winter season and can aid in the development of strong upper-level ridging near or over the Aleutian Islands of Alaska.
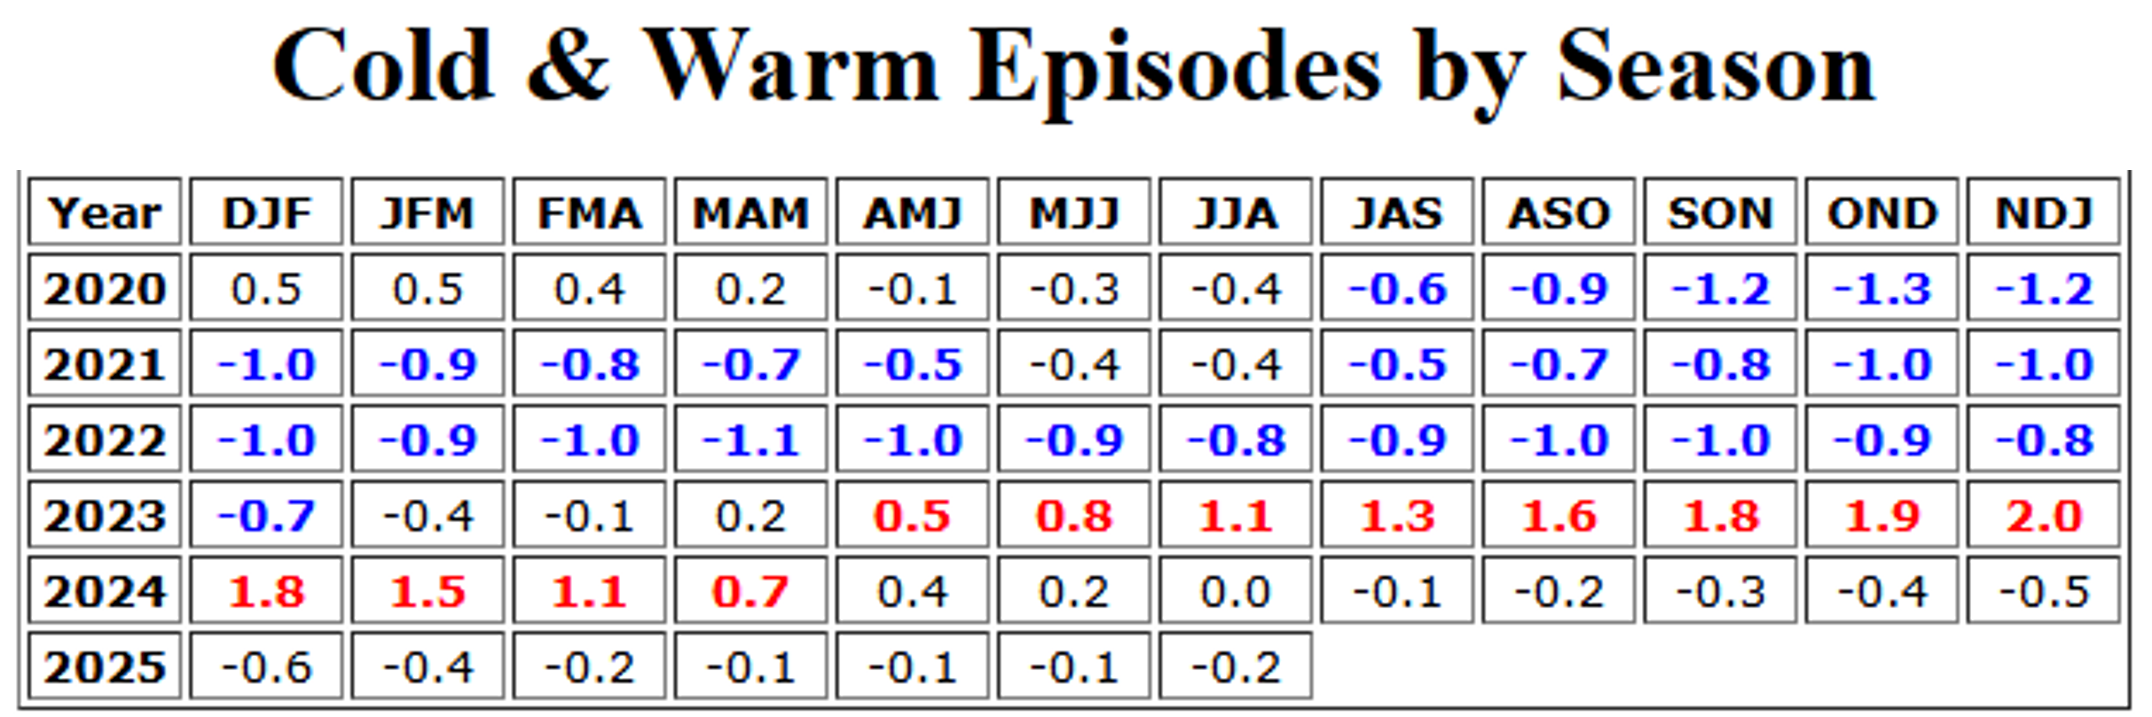
Warm (red) and cold (blue) periods in this table are based on a threshold of +/- 0.5oC for the Oceanic Niño Index (ONI) [3 month running mean of ERSST.v5 SST anomalies in the Niño 3.4 region (5oN-5oS, 120o-170oW)]. For historical purposes, periods of below and above normal SSTs are colored in blue and red when the threshold is met for a minimum of 5 consecutive overlapping seasons. (Source)
Prospects for “High Latitude Blocking (HLB)”
AO/NAO autumnal trends (AO: neutral signal for HLB; NAO: favorable signal for HLB)
In addition to the analysis of sea surface temperatures, it is important in the long-range forecasting of a winter season to evaluate the prospects for “high latitude blocking” in the atmosphere. “High-latitude blocking” in the atmosphere is tracked by meteorologists through teleconnection indices such as the Arctic Oscillation (AO) and its closely related cousin called the North Atlantic Oscillation (NAO). The AO and NAO teleconnection indices refer to temperature and pressure patterns in the middle and high latitudes and can bounce between “positive” and “negative” values. When these two indices are simultaneously in “negative” territory for extended periods of time during a winter season, the prospects for “high-latitude blocking” tends to increase. “High-latitude blocking” is characterized by tenacious high pressure in northern latitude areas such as Greenland, northern Canada, and Iceland, weaker zonal winds, and greater movement of polar air into the middle latitudes such as the Mid-Atlantic region – and, in turn, an increased chance of snow. When the AO/NAO is consistently “positive” (i.e., lack of “blocking”), surface pressure is low in the polar region, and this helps the mid-latitude jet stream to blow strongly and consistently from west-to-east keeping Arctic air locked up in the polar region.


Arctic Oscillation (AO, top) and North Atlantic Oscillation (NAO, bottom) index trends from mid-June to the present. Plots courtesy NOAA/CPC
The trends of these two teleconnection indices in the fall season often provide clues as to what to expect during the subsequent winter season. For example, if the NAO is often in “negative” territory during the fall season then odds favor it being in “negative” territory quite often during the ensuing winter season. So far this fall season, the AO has generally hovered around the “neutral” area which sends a “neutral” signal that there will be frequent “high-latitude blocking” situations this winter. The NAO, however, has recently dropped markedly into “negative” territory which is a favorable sign that the prospects for “high-latitude blocking” this winter are quite good (i.e., NAO may be in “negative” territory for much of the time during this upcoming winter season).
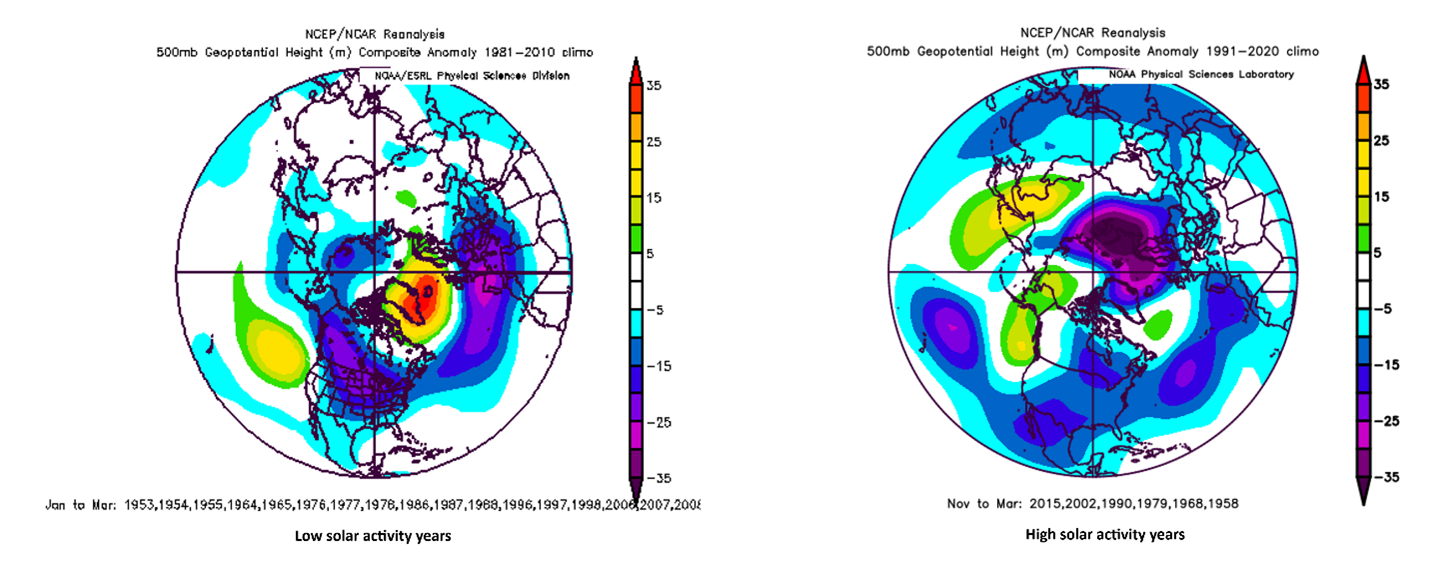
Typical 500 mb height anomaly patterns during low solar activity periods (left, high-latitude blocking) and high solar activity years (right, lack of high-latitude blocking). This winter should feature high solar activity levels as we are near the solar maximum phase of solar cycle #25. Graphics courtesy NOAA/NCEP
High solar activity (an unfavorable signal for HLB)
In addition to the trends of the AO and NAO teleconnection indices, another important aspect to consider with respect to the prospects for “high latitude blocking” during winter seasons is the level of solar activity. The 500 millibar height anomaly plots show a clear tendency of “high latitude blocking” patterns during low solar activity years (left plot) with higher heights on average over Greenland/Canada/Iceland and the opposite holds true during high solar activity years with a lack of “high-latitude blocking”. As we are currently approaching the solar maximum phase for cycle #25 (or perhaps in it already), solar activity is expected to remain on the high side during this winter season which is an unfavorable signal for “high-latitude blocking” events.

Snow cover has increased across portions of Siberia from late September until the present time and this typically is correlated with an enhanced chance for high-latitude blocking events during the subsequent winter season. Maps courtesy NOAA
Increasing and above-normal autumnal snowpack across Asia (favorable signal for HLB)
Similar to the trends of the AO and NAO teleconnection indices and the overall levels of solar activity, it has been found that the trend of snow cover in the northern hemisphere during the fall season can be used as a predictive factor with respect to “high latitude blocking” patterns during subsequent winter season. Specifically, researchers have pinpointed the region in Siberia below 60°N during the month of October as critical with respect to the likelihood of “high latitude blocking” atmospheric patterns during the succeeding winter season. As an example, if snowpack is above-normal and consistently expanding during early October in that part of Siberia, research studies and empirical observations have shown that there is an increased chance for more frequent “high-latitude blocking” formations in subsequent winter months. In fact, there has been an increase in snow cover across Siberia from the latter part of September to the middle of October which sends a favorable signal on the potential of “high-latitude blocking” events during the upcoming winter season.
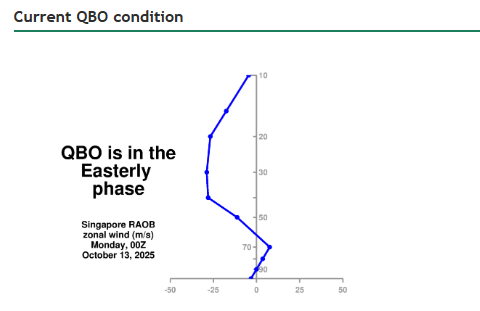
"QBO is in the Easterly phase" describes the Quasi-Biennial Oscillation when equatorial stratospheric winds blow from the east. This phase is typically associated with weaker polar vortex winds which can lead to a weaker Atlantic jet stream and a greater chance of cold winters in Northern Europe and the Eastern U.S. Plot courtesy NASA
Quasi-Biennial Oscillation (QBO)
An atmospheric phenomenon known as the “Quasi-Biennial Oscillation” (QBO) is a changing wind anomaly in the tropical lower stratosphere. It has been found that strong stratospheric winds along an equatorial belt tend to completely change direction about every 14 months or so and this oscillation appears to play a crucial role in seasonal weather patterns as it can impact the polar vortex and the overall jet stream. Specifically, the tropical lower stratosphere winds flip from west-to-east or east-to-west every 14 months or so, an average period of about 28 months to return to the starting state.

An “easterly” QBO pattern has been found to correlate quite well with a weaker polar vortex and an increased tendency for “sudden stratospheric warming” events. Plot courtesy NOAA, Meteorologist Mark Margavage (X)
Currently, the QBO features an east-to-west flow or what is known as a “negative” (easterly) phase. In fact, the QBO has been increasingly “negative” in recent months (-13.72 in June, -19.99 in July, -22.38 in August, -24.26 in September) as calculated by NOAA’s Physical Sciences Laboratory for the zonally averaged 30 mb winds at the equator (credit NOAA (“Get Data/Time Series List”)). Recent upper air observations from NASA radiosondes suggest the “negative” QBO phase will likely continue during the upcoming winter season which is typically favorable for colder-than-normal weather in the eastern US.
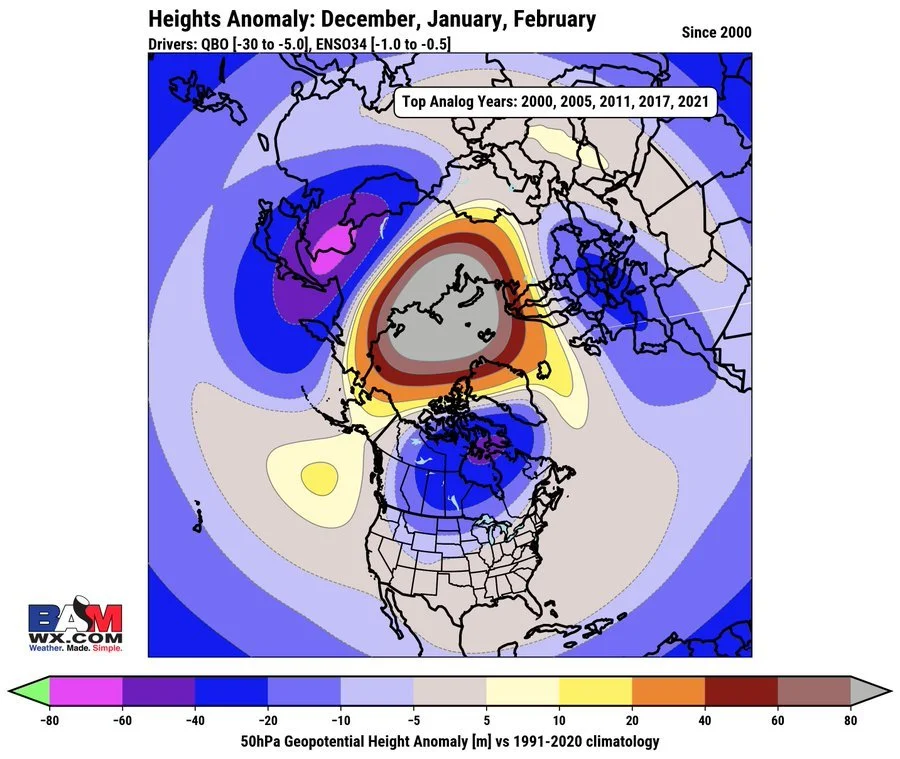
Upper atmosphere (50 mb) height anomalies are shown for the winter months of December, January, and February in years with relatively weak La Nina (-1.0 to -0.5) conditions in the equatorial Pacific Ocean combined with a “negative” QBO (-30.0 to -5.0). The average upper air height anomalies during these “analog” years featured a displaced polar vortex onto the Hudson Bay region of Canada which would enhance the chances of cold air outbreaks to make their way from Canada into the Northern US. (Map courtesy BAMwx.com)
When an “easterly” or “negative” phase of the QBO is combined with La Nina, there is a strong tendency for an increase in Sudden Stratospheric Warming (SSW) events and the disruption of the polar vortex, a weaker Atlantic jet stream, and cold winters in northern Europe and the eastern US. On the other hand, a westward or “positive” phase of the QBO often coincides with mild winters in northern Europe and the eastern US. Sudden stratospheric warming events and the disruption of the polar vortex in the Northern Hemisphere winter characteristically increase the chance for Arctic air outbreaks to reach the lower latitudes from the higher latitudes. The easterly phase also encourages a negative North Atlantic Oscillation (NAO), which can funnel cold air into North America. Conversely, the westerly QBO phase is generally associated with stronger jet streams and milder winters.
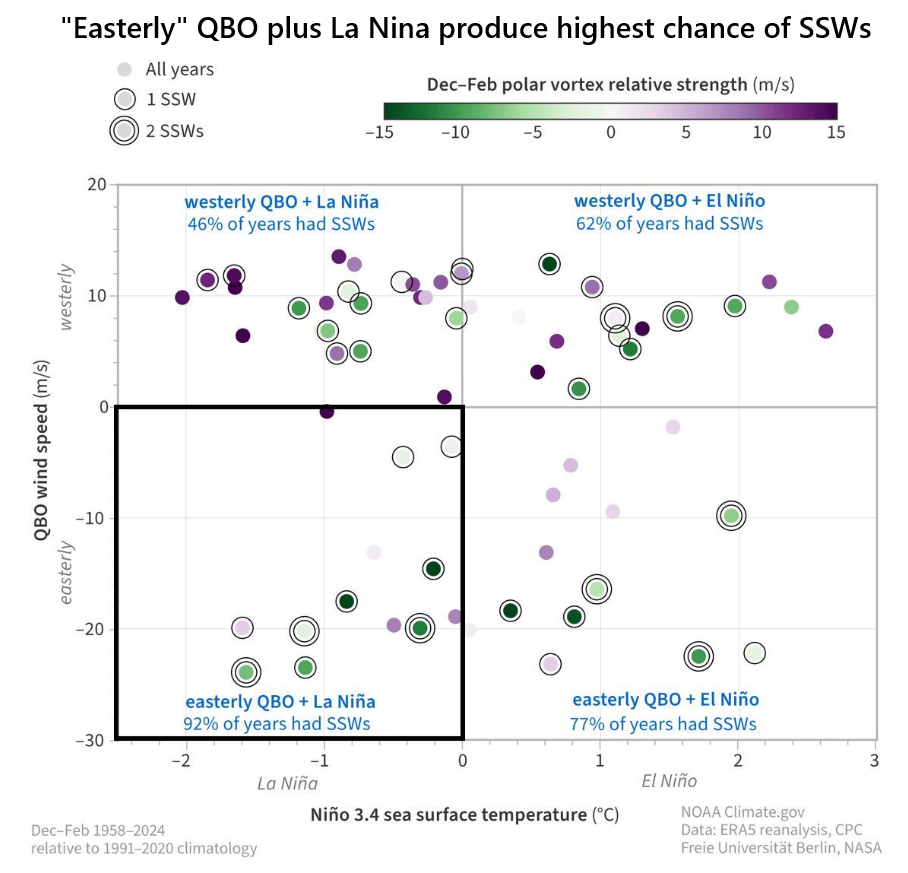
The combination of an “easterly” or “negative” phase of the QBO with La Nina conditions in the central equatorial Pacific Ocean raises the chances appreciably for “Sudden Stratospheric Warming” events and polar vortex disruptions (lower, left box). Graphic courtesy NOAA, Meteorologist Mark Margavage (X)
A look at temperature and precipitation patterns during “analog” years
In addition to the evaluation of such metrics as oceanic temperature patterns and teleconnection index trending, it is quite useful in my opinion for purposes of long-range weather forecasting to find and analyze the temperature and precipitation patterns of analog years in which there similar El Nino-Southern Oscillation (ENSO) conditions in the tropical Pacific (i.e., El Nino, La Nina or neutral) and other areas across the globe. The temperature and precipitation patterns during these analog years can provide us with some clues as to what kind of winter weather we may experience across the nation.

The sea surface temperature anomaly pattern for five selected analog years is quite similar to today’s overall pattern featuring La Nina conditions in the equatorial Pacific Ocean and warmer-than-normal water throughout much of the northern Pacific Ocean. Plot courtesy NOAA, tropicaltidbits.com
In the selection of my analog years, I focused on years in the past that featured neutral-to-weak La Nina conditions in the tropical Pacific Ocean and I also factored in those years with a negative QBO. Indeed, I believe the following five winter seasons of 2011-2012, 1970-1971, 1967-1968, 2013-2014, and 2010-2011 have met these thresholds. The highest weighting in the generation of analog year temperature and precipitation average anomalies across the US was given to the winter seasons of 2011-2012 and 1970-1971 as, of the selected five, these two winters featured the most similar sea surface temperature AND negative QBO patterns as to what I expect to see during the upcoming winter season.
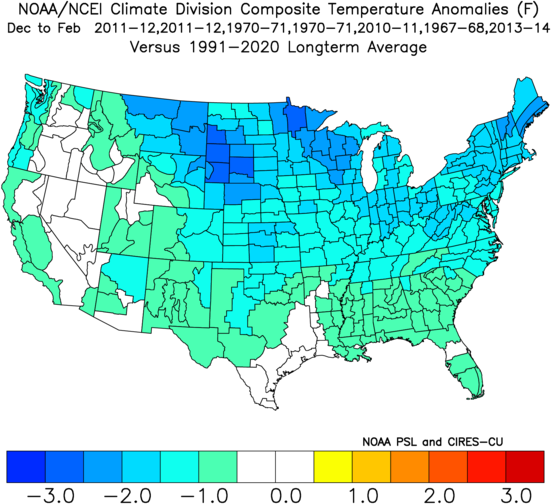
Average December-to-February temperature anomaly pattern for the five analog years. Plot courtesy NOAA/NCEI/PSL
These five analog winter seasons resulted in temperatures that averaged below normal across much of the eastern two-thirds of the nation for the December through February period. As far as precipitation is concerned, these five analog years featured nearly normal conditions across much of the northern US and drier than normal across much of the southern areas from Florida-to-Texas-to-California. In the Mid-Atlantic region, precipitation amounts were generally near normal which would likely result in normal-to-slightly above normal snowfall amounts given the expectation of a colder-than-normal winter season.
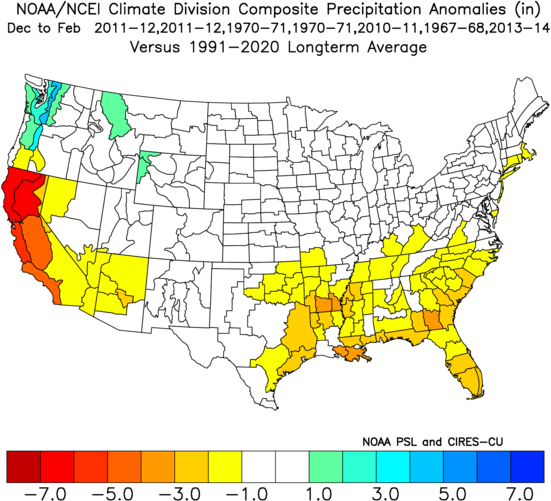
Average December-to-February precipitation anomaly pattern for the five analog years. Plot courtesy NOAA/NCEI/PSL
Conclusions
Numerous factors have been analyzed in the preparation of the “2025-2026 Winter Outlook” to provide us with some clues about the upcoming winter season. These factors include such metrics as global sea surface temperature patterns, prospects for “High-Latitude Blocking”, trends of several teleconnection indices (e.g., AO, NAO, QBO), and at the temperature and precipitation anomalies during selected “analog” years.
Based on this detailed analysis, I believe the Mid-Atlantic region will experience a colder-than-normal winter season with departures from normal in the range of -1.0°C to -3.0°C. There should indeed be some impressive Arctic air outbreaks that make their way from northwestern Canada/Alaska all the way into the Mid-Atlantic region riding in on what should be a strong polar jet stream during the upcoming “weak La Nina-to-neutral” winter season.
Snowfall amounts should be in the “normal-to-slightly above normal” range with 14-18 inches in Washington, D.C., 22-26 inches in Philadelphia, and 25-29 inches in New York City (noticeably higher amounts are possible in some of the northern and western suburbs of these three big cities). The winter could be “back loaded” in terms of snowfall with much falling during the second half of the season partly because of the likelihood for weak La Nina conditions in the tropical Pacific Ocean to transition into neutral territory which is a bit more favorable for storm development.
Elsewhere, the dominating weather pattern this winter should feature drier and warmer conditions compared to normal across much of the southern US from Florida-to-Texas-to-California, and the coldest temperatures relative-to-normal are likely to be concentrated on the Upper Midwest and Northern Plains.
Meteorologist Paul Dorian
Arcfield
arcfieldweather.com
Follow us on Facebook, Twitter, YouTube
Video discussion: