*Arctic sea ice continues to show resiliency...nearly normal temperatures expected during the all-important summer (melting) season...the possible important role of water vapor*
Paul Dorian

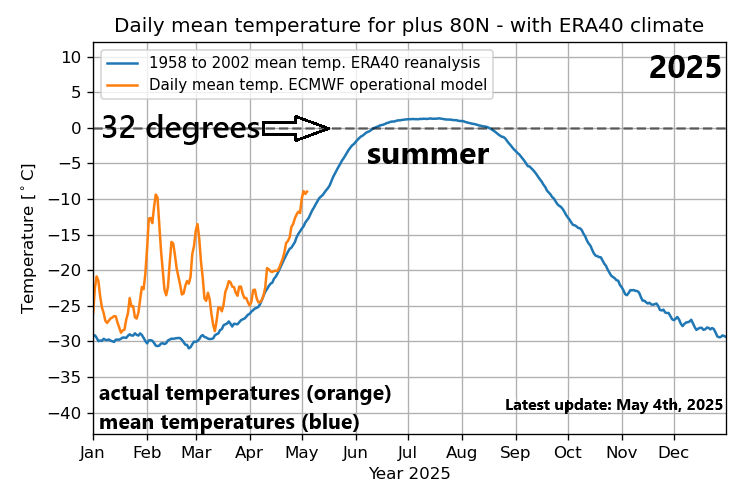
This plot compares actual temperatures (orange) to mean temperatures (blue) in the Arctic region during 2025. Following long-term trends, temperatures during these cold season months have been generally running at above-normal levels. And if long-term trends hold true for the summer (melting) season, then temperatures in June, July, and August should run at nearly normal levels which happens to be right around the 32 degree (F) mark. As long as temperatures remain close-to-normal during the summer (melting) season, there will likely be a limit to the amount of additional melting that can take place with respect to the Arctic sea ice. Data courtesy Danish Meteorological Institute
Overview
The summer season is fast approaching, and probabilities are high that overall temperatures in the Arctic region will be nearly normal which happens to be right around the 32 degree (F) freezing mark. Chances are indeed high since this temperature pattern of nearly normal conditions during the summer months of June, July, and August has taken place virtually every year since the turn of the century. Meanwhile, the other nine months of the year in the Arctic region have featured above-normal temperatures in a pattern that too has also been very consistent in recent years.
It is the temperatures in the summer months of June, July, and August, however, which are the most important when it comes to Arctic sea ice extent as this is the melting season up in that part of the world. Arctic sea ice extent has been running at below-normal levels since the middle 1990’s; however, if temperatures again remain nearly normal during the summer (melting) season, the chance for any additional significant drop off will be limited. Indeed, given this consistent summertime temperature trend in recent years, Arctic sea ice has shown resiliency both in terms extent and in volume. One possible explanation of this persistent temperature pattern across the Arctic region featuring nearly normal summertime conditions and warmer-than-normal during the coldest nine months of the year is the increased levels of water vapor in the atmosphere.

The temperature pattern in the Arctic region during 2024 featured nearly normal levels during the summer (melting) season and above-normal conditions during the other (coldest) nine months of the year. Data courtesy Danish Meteorological Institute
Arctic temperatures and the impact on sea ice
Temperatures have followed a persistent trend in the Arctic region during the past several years, in fact, this pattern has persisted going all the way back to the beginning of the 21st Century. Specifically, temperatures have been running at nearly normal levels during the all-important summer (melting) season of June, July, and August, and then usually at well above-normal levels during the remaining nine months of the year.

The temperature pattern in the Arctic region during the last several years has featured nearly normal levels during the summer (melting) season of June, July, and Augusts, and above-normal conditions during the other (coldest) nine months of the year. In fact, this kind of annual temperature pattern in the Arctic region has been quite consistent since the turn of the century. Data courtesy Danish Meteorological Institute
Nearly normal temperatures in the months of June, July and August are typically at levels near or just above the freezing mark and as long as they remain there during the melting (summer) seasons chances of any additional significant drop-off in Arctic sea ice will be limited. Well above-normal temperatures in the other nine months of the year has a minimal impact on the melting of Arctic sea ice as they are typically well below the freezing mark. Indeed, with this dependable temperature trend in recent years, Arctic sea ice has been rather resilient both in terms of extent and volume, going back a dozen years or so.
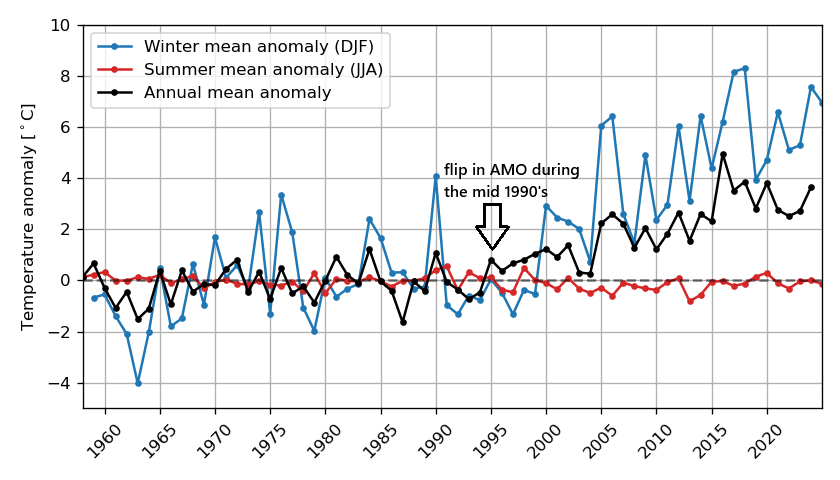
Anomaly of the +80N mean temperature index is shown here back to 1960, compared with climate (annual mean minus the corresponding climate value). “All year” anomaly is illustrated with the black line and has climbed since the middle 1990s. The “summertime” anomaly of June, July, and August is illustrated with red and has held at nearly normal levels since 1960 while winter mean anomalies (blue line) has shown an increase since the middle 1990’s. An important shift in the Atlantic Multidecadal Oscillation (AMO) took place during the middle 1990’s (indicated by arrow) when it flipped from a “negative-to-positive” phase. Reference climate is ECMWF-ERA40 1958-2002. Plot courtesy Danish Meteorological Institute
Arctic sea ice extent has been running at below-normal levels since the middle 1990’s at which time there was an important shift in the Atlantic Multidecadal Oscillation (AMO) to one featuring warmer-than-normal sea surface temperatures in the North Atlantic Ocean. The Arctic sea ice extent headed steadily downward after that shift and reached its lowest point in 2012 at levels not seen before during the satellite era which goes back to the late 1970’s. Since then, however, Arctic sea ice extent has held rather steady with a general sideways trend during the past dozen years or so. Some recent studies confirm the “resiliency” seen during recent years in Arctic sea ice extent and have found that it not only has been detected during the month of September - the time of annual minimum - but has been evident in each and every other month of the year.

Arctic sea ice volume as estimated by the University of Washington’s PIOMAS numerical model shows resilience during the last dozen years or so with a “sideways” trend (boxed in region). This model output data is updated on a monthly basis and is shown here through March 2025. Details on the PIOMAS model are available here.
In addition to sea ice extent, an important climate indicator to monitor is sea ice volume as it depends on both ice extent and thickness. Arctic sea ice volume is difficult to monitor on a continuous basis as observations from satellites, submarines and field measurements are all limited in space and time. As a result, one of the best ways to estimate sea ice volume is through the usage of numerical models which utilize all available observations. One such computer model comes from the University of Washington and is called the Pan-Arctic Ice Ocean Modeling and Assimilation System (PIOMAS, Zhang and Rothrock, 2003). This model-derived Arctic sea ice volume shows a steady downward trend from the middle 1990s to the low point reached in 2012 and then a general sideways trend until the present time.

Relative humidity (left) and surface temperatures (right) have averaged higher-than-normal during the wintertime in the Arctic region (indicated by arrows) for the last ten years (2014-2024). An increase in water vapor (and relative humidity) in the cold, dry cold season of the Arctic can have much more impact on air temperatures as compared to during the warmer, and more humid summer (melting) season. Maps courtesy NOAA/NCAR
The possible important role of water vapor
The somewhat strange behavior of the temperatures in the Arctic region in recent years with nearly normal summer seasons of June, July, and August, and the warmer-than-normal conditions during the other (coldest) nine months of the year suggests to me that water vapor may be playing a key role. Water vapor content has increased on average around the world during the past couple of decades largely as the result of warmer-than-normal sea surface temperatures in both the North Atlantic (positive AMO) and the Pacific Ocean (multiple El Nino events). Warmer-than-normal water temperatures leads to increased evaporation and this, in turn, results in higher water vapor content in the atmosphere.
A key point here is that an increase in water vapor will have a bigger impact on temperatures in very cold and dry environments and less impact on warmer and more humid atmospheres. In other words, if water vapor is indeed increased throughout the world, the impact on temperatures in the tropics - where it is warm and humid throughout the year - would be quite small compared to its impact in the Arctic region. And in the Arctic region, an overall increase in water vapor content would have a much bigger impact on temperatures in the coldest nine months of the year when it can be extremely cold and dry as compared with the typically warmer and more humid summer (melting) season…all leading to the somewhat odd temperature pattern that we have seen in the Arctic region in virtually all years since the turn of the century.
Meteorologist Paul Dorian
Arcfield
arcfieldweather.com
Follow us on Facebook, Twitter, YouTube