
*2026 Tropical and Summertime Outlook*
Paul Dorian
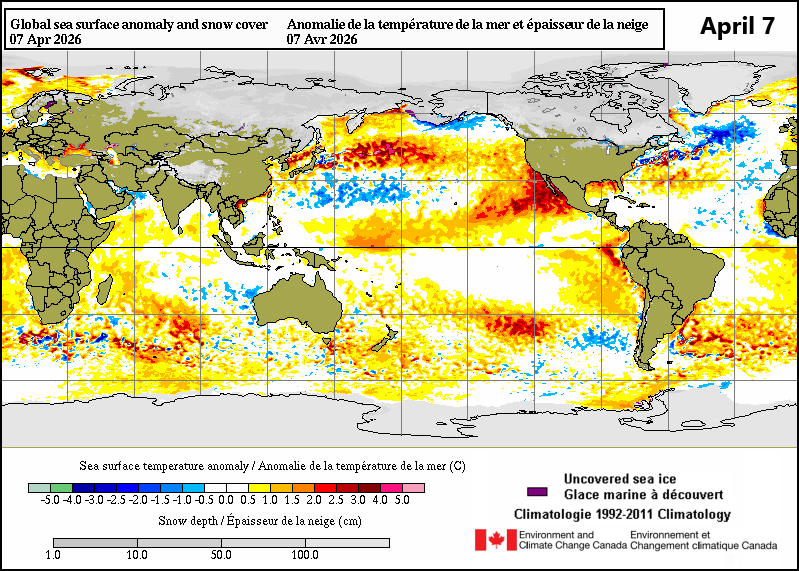
Sea surface temperature (SST) anomalies as of April 7th, 2026. La Nina (colder-than-normal) conditions have disappeared in the equatorial Pacific Ocean in recent weeks, and water temperatures are generally normal to below normal across portions of the Atlantic’s Main Development Region (MDR). Map courtesy Canadian Met Centre
Overview
The number of named tropical storms in 2026 is likely to be slightly below normal in the Atlantic Basin due mainly to water temperature patterns in both the Pacific and Atlantic Oceans. The average number of named tropical storms in an Atlantic Basin tropical season is 14.4 with 7.2 of those reaching hurricane status, and 3.2 attaining “major” designation of category 3 or higher. Based on the overall analysis of current and forecasted atmospheric and oceanic conditions, I expect to see around 12 named storms in the Atlantic Basin this tropical season with about 6 of those reaching hurricane status and of those perhaps 2 to achieve “major” classification level.
Two important factors in this year’s tropical outlook include the expected development of an El Nino episode in the tropical Pacific Ocean featuring warmer-than-normal water, and colder-than-normal water in portions of the Atlantic Ocean’s Main Development Region (MDR). Both sea surface temperature patterns would tend to inhibit tropical storm formation and intensification in the Atlantic Basin. In terms of summertime weather conditions across the continental US, I expect much of the nation to be cooler-than-normal and it is a mixed picture when it comes to precipitation with wetter-than-normal weather likely for the northeastern states and generally drier-than-normal conditions across the central states.

A list of names to be used during the 2026 Atlantic Basin tropical season for the named tropical storms/hurricanes.
Executive Summary
Slightly below-normal number of named tropical storms, hurricanes, and “majors”
El Nino conditions in the equatorial Pacific Ocean
increased wind shear in the Atlantic Basin, especially over the Caribbean Sea
increased downward motion in the Atlantic Basin
· Cooler-than-normal water in portions of the Atlantic Ocean’s Main Development Region (MDR)
An analysis of four selected “analog” years suggests the following:
Below-normal hurricane activity in the Atlantic Basin
Cooler-than-normal summertime weather across much of the nation
Mixed picture on precipitation with wetter-than-normal conditions likely in the northeastern states and generally drier-than-normal weather across the central states
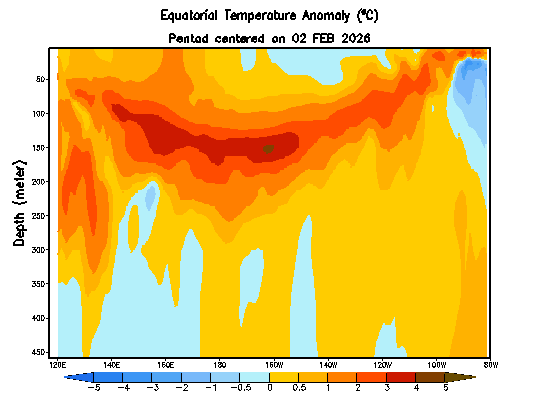
Sub-surface water temperature anomalies (°C) down to a depth of 450 meters are shown here from the equatorial part of the Pacific Ocean in the period from 02 February 2026 to 03 April 2026. Much warmer-than-normal water (shown in orange/brown) is now lurking just beneath the surface (top) across much of the tropical Pacific and the cold water (shown in blue) at and just below the surface level has tended to shrink in extent in recent days. Map courtesy NOAA/CPC, International Research Institute [Note – “Nino 3.4” region is 120°W-170°W.]
Recap of the 2025 Atlantic Basin tropical season
The 2025 Atlantic hurricane season was somewhat intriguing in that it featured long stretches of quiet weather along with intense bursts of tropical activity and will probably be most remembered by a powerful late season category 5 hurricane. The number of named tropical storms (13) and hurricanes (5) was slightly below the long-term average of 14 and 7 respectively in 2025; however, the season featured an unusually high number of category 5 hurricanes (three). In addition, perhaps the best metric of tropical activity is known as the Accumulated Cyclone Energy (ACE), and it registered above average overall numbers for the Atlantic Basin tropical season. ACE factors in both the storm’s magnitude and its duration so a long-lasting powerful hurricane can add considerably to the overall numbers and indeed, that was the case in 2025 with Hurricane Melissa.
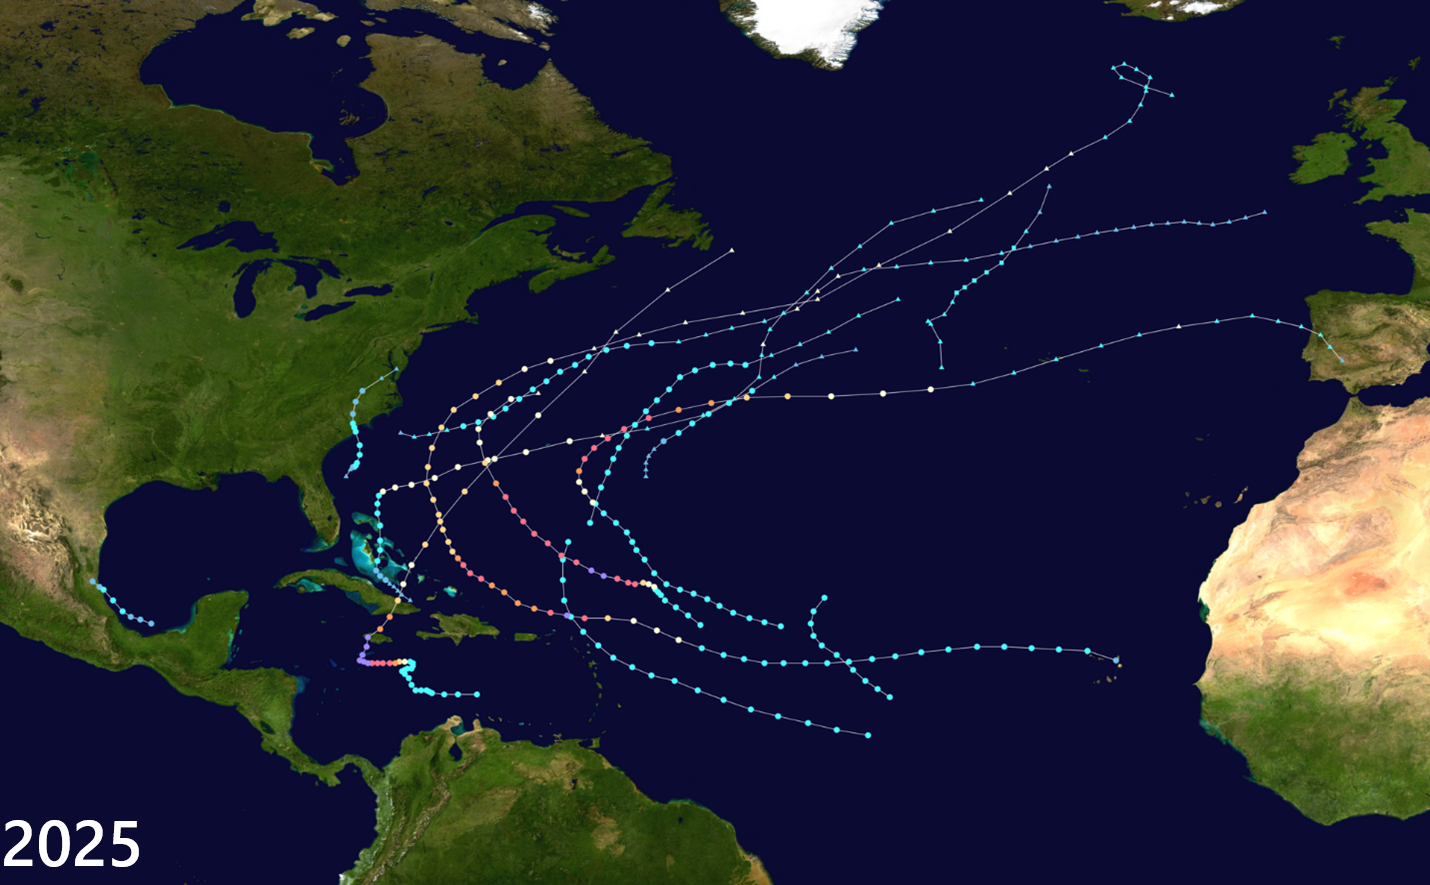
2025 Atlantic Basin tropical storm tracks are shown on this plot, and it was slightly below-average year in terms of number of named storms (13) but had a higher-than-average Accumulated Cyclone Energy (ACE) for the Atlantic Basin which is a metric that factors in both storm magnitude and longevity. (Plot courtesy Wikipedia)
Hurricane Melissa was an extremely powerful late season storm that made landfall in Jamaica on October 28th as a category 5 hurricane, tying the record for the strongest Atlantic Basin landfall in nearly 100 years. Hurricane Melissa and Hurricane Allen (1980) are the only Atlantic hurricanes to attain maximum sustained winds of 190 mph. In terms of minimum pressure, Hurricane Melissas is tied with the 1935 Labor Day hurricane as the third-most intense Atlantic hurricane on record. This late season powerful tropical cyclone had a relatively long duration of ten days or so which added considerably to the overall Accumulated Cyclone Energy amounts for the 2025 season.
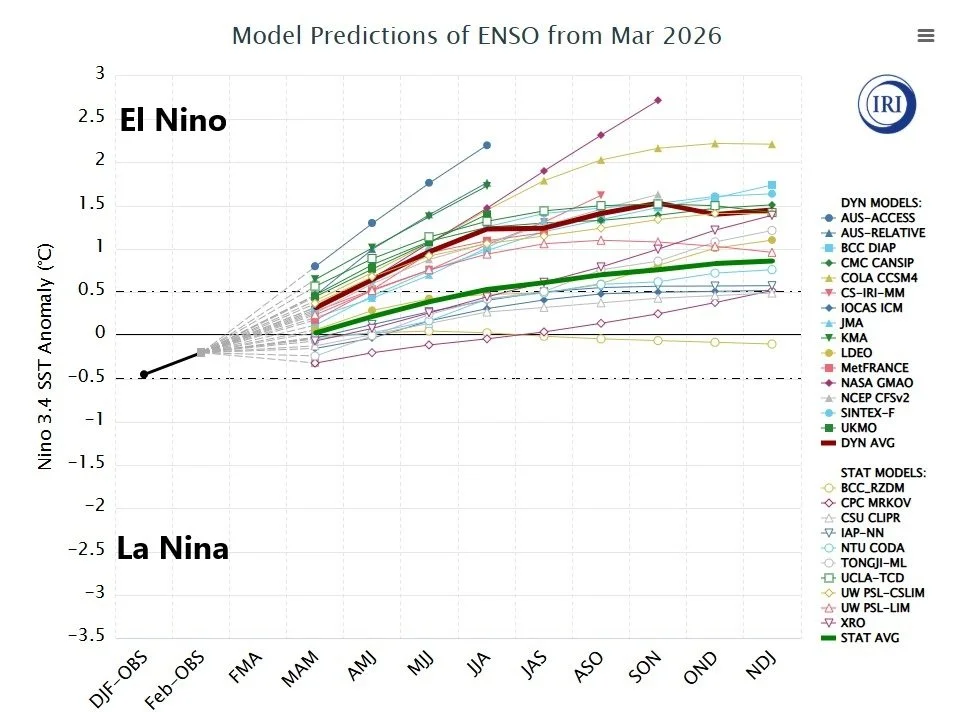
Forecasts of sea surface temperature (SST) anomalies are shown for the “Nino 3.4” region (5 °N-5°S, 120°W-170°W) of the tropical Pacific by a compilation of computer forecast models with general agreement on El Nino conditions after brief period of “ENSO-neutral”. The computer models encompass two types – statistical and dynamic – with the average of each highlighted (red for dynamic, green for statistical). Plot courtesy NOAA, ECMWF, JMA, KMA, Canadian Met Centre, International Research Institute
El Nino in the tropical Pacific Ocean
What goes on in the equatorial Pacific Ocean does indeed influence the tropical season in the Atlantic Basin. El Nino, which refers to warmer-than-normal surface water temperatures in the tropical Pacific Ocean, affects global weather patterns and it tends to be an inhibiting factor for tropical storm formation or intensification in the Atlantic Basin. First, El Nino tends to produce faster-than-usual high-altitude winds over the tropical Atlantic Ocean with a focus usually on the Caribbean Sea, and this increase in wind shear (change of wind speed with height) is hostile to the development or maintenance of tropical storms. In addition, El Nino tends to result in sinking motion over parts of the Atlantic Basin which also is hostile to tropical storm formation or intensification.
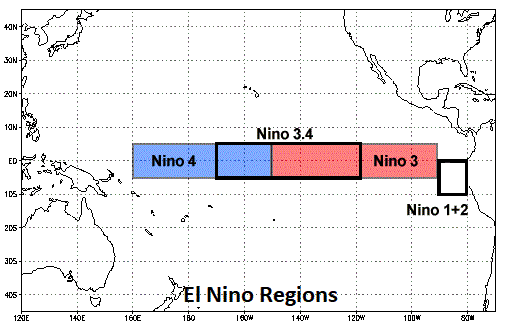
The El Nino region of the Pacific Ocean is sub-divided by meteorologists into sub-sections as outlined on this map with “Nino 3.4” region (5 °N-5°S, 120°W-170°W, boxed region in middle) in the central part of the equatorial Pacific Ocean and “Nino 1+2” (boxed region at right) positioned near the west coast of South America.
La Nina conditions have generally dominated the scene in the tropical Pacific Ocean since the summer of 2024, but a flip to El Nino is likely to take place by the early part of the summer with support for this idea coming from actual observations and computer model forecasts. Once established, signals are strong that El Nino will continue through the fall season – likely as “moderate-to-strong” in magnitude in my opinion - and potentially, it can last right into the winter season of 2026-2027.
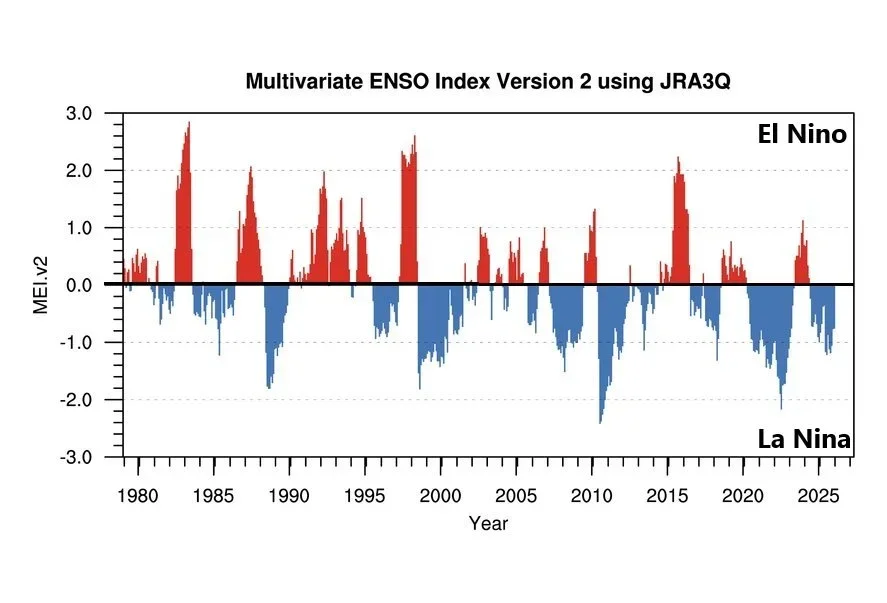
The Multivariate ENSO Index (MEI), which combines both oceanic and atmospheric variables, facilitates in a single index assessment of ENSO. It provides real-time indications of ENSO intensity, and through historical analysis, it provides a context for meaningful comparative study of evolving conditions (El Nino in red, La Nina in blue). The strongest El Nino events since 1980 took place during 1982-1983, 1997-1998 and 2015-2016. Plot courtesy NOAA/PSL
Cooler-than-normal water in parts of Atlantic’s Main Development Region
Not only are Pacific Ocean sea surface temperatures important in terms of potential impact on tropical activity in the Atlantic Basin, but Atlantic Ocean water temperatures are critical and play more of a direct role in the prospects for formation/intensification of tropical storms. Sea surface temperatures of >80°F are generally considered to be necessary (minimum) conditions for the formation of tropical storms in the Atlantic Basin.
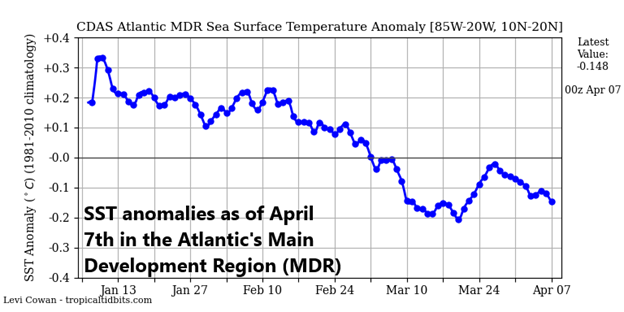
Water temperatures in the Atlantic Ocean’s Main Development Region (MDR) trended downward during the winter season and remain slightly below normal as we progress through early spring. We’ll monitor this to see if water temperatures remain in colder-than-normal territory as we get closer to the summer (tropical) season as it would an unfavorable pattern for tropical storm and intensification in the Atlantic Basin. Map courtesy NOAA, tropicaltidbits.com
As a result, above-normal sea surface temperatures are more favorable for the formation and intensification of tropical storms as waves often take the long westward trek over the tropical Atlantic Ocean from western Africa. Indeed, the water temperatures in the Main Development Region (MDR) region of the Atlantic Ocean have trended downward in recent months and have slipped into below-normal territory – an unfavorable development for tropical storm formation and intensification if it holds through the summer season.
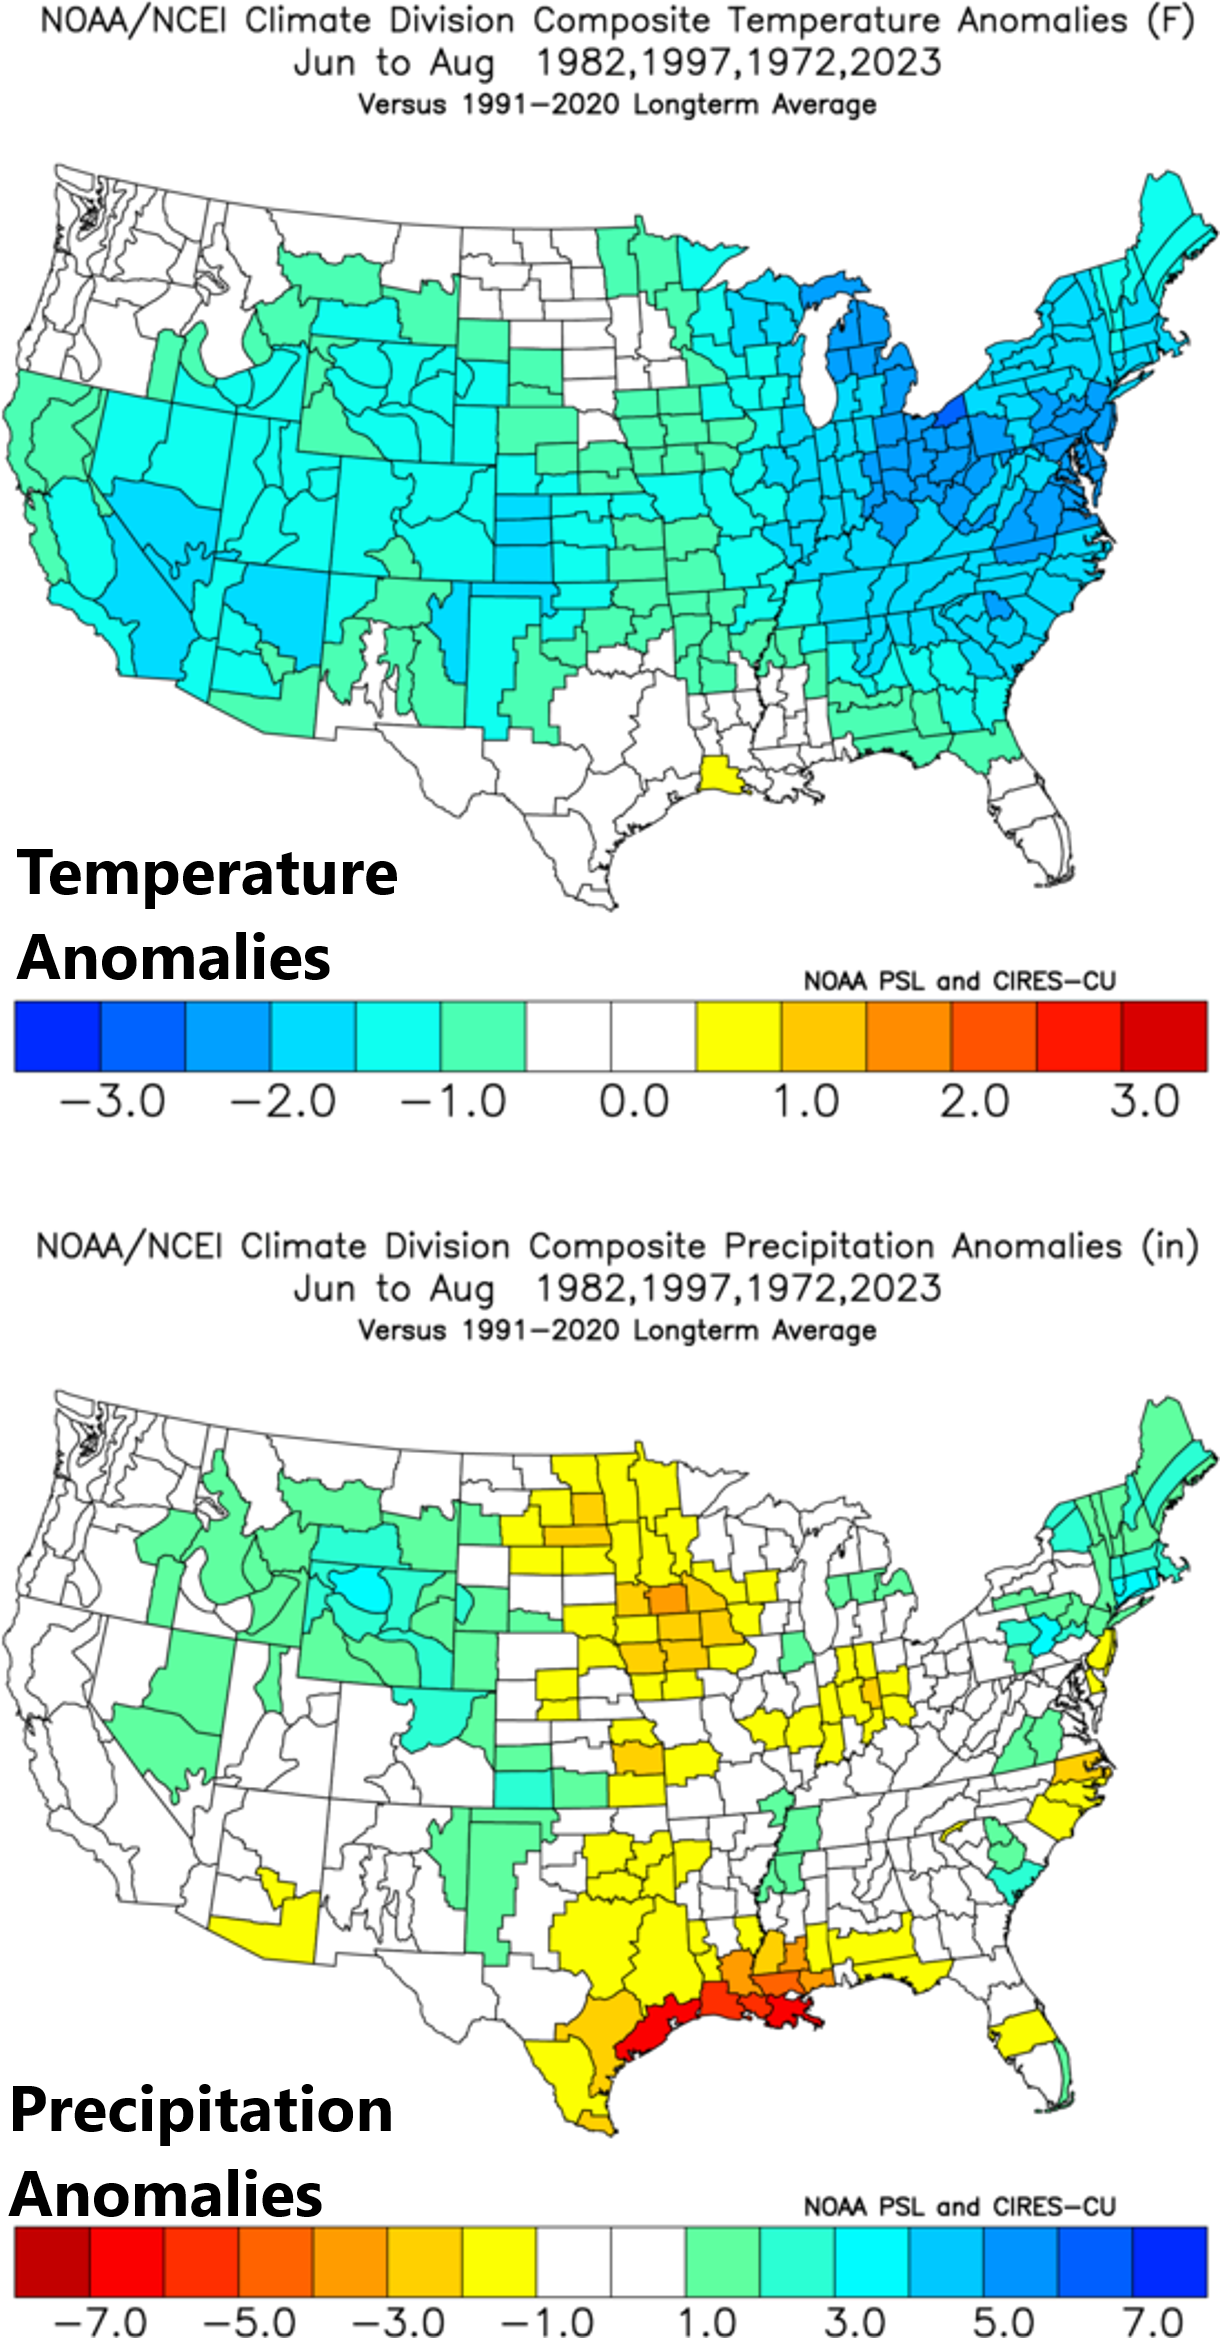
The average of four “analog” years (1982, 1997, 1972, 2023) that I have selected based on comparisons with sea surface temperature patterns (upper plot) suggest cooler-than-normal conditions across much of the nation and a mixed picture with respect to precipitation amounts (lower plot) generally with wetter-than-normal weather for the northeastern states and drier-than-normal conditions across the central states. Maps courtesy NOAA
Summertime outlook for the continental US...”analog” years comparison
In preparation for the tropical and summertime outlook, I have searched for “analog” years in which water temperature patterns were like what I expect to see this summer and fall. By looking at these “analog” years, one can get a clue as to what temperature and precipitation patterns can be across the continental US. In this year’s search, I have sought to find past years in which La Nina transitioned to moderate-to-strong El Nino conditions in the tropical Pacific and at the same time, there were cooler-than-normal waters in at least parts of the Atlantic’s Main Development Region.
As such, I have determined that the following four years match rather closely to what is expected this summer and fall: 1982, 1997, 1972, 2023. When averaged together, these selected “analog” years featured below-normal tropical activity with ~10 named tropical storms, ~4 hurricanes, and ~1 “major”. Also, when averaged together, these 4 analog years featured cooler-than-normal conditions across a large part of the nation with a focus on the Mid-Atlantic region. In terms of precipitation amounts, the picture is somewhat mixed with generally wetter-than-normal conditions across the northeastern states and drier-than-normal weather in much of the central US.
Meteorologist Paul Dorian
Arcfield
arcfieldweather.com
Follow us on Facebook, Twitter, YouTube
Video discussion: