
*Arctic temperatures running at historically low levels as we begin the summer season…portions of the Atlantic Ocean have cooled quite noticeably in the past year...change in AMO?*
Paul Dorian
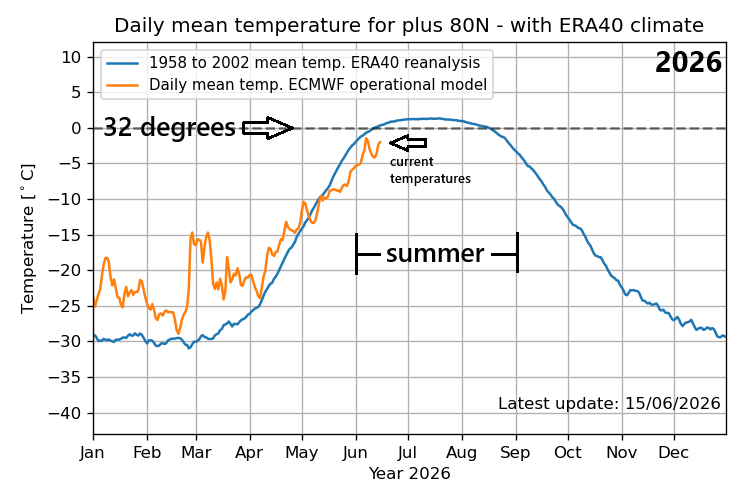
This plot compares actual temperatures (orange) to mean temperatures (blue) in the Arctic region during 2026. Following long-term trends, temperatures during the cold season months were generally well above normal. And, if long-term trends hold true for the summer (melting) season, temperatures during June, July, and August should run at or below normal (“normal” is near freezing). In fact, temperatures in the Arctic region during the first half of June 2026 are running at historically low levels relative to normal...not seen during this time of year since data records began in 1958. As long as temperatures remain at or below normal during the summer (melting) season, there will likely be a limit to the amount of additional melting that can take place with respect to the Arctic sea ice. Data courtesy Danish Meteorological Institute
Overview
The summer season is upon us, and probabilities are quite high that overall temperatures in the Arctic region will be at or below normal if long-term trends hold true. In fact, temperatures in the Arctic region during the first half of June are at historically low levels when compared to any year back to 1958 which is when data records began for this area. Interestingly, water temperatures in portions of the Atlantic Ocean have cooled off quite noticeably during the past year or so and cooler-than-normal water in the Main Development Region of the tropical Atlantic can have an inhibiting effect on tropical activity. Perhaps this change in water temperatures in the Atlantic Ocean and the drastic start to the summer season with respect to temperatures in the Arctic is signaling an upcoming change in the Atlantic Multidecadal Oscillation (AMO) which has been in a “positive” phase since the middle 1990’s.
“Normal” temperatures in the Arctic region during the summer season are right around the 32 degree (F) freezing mark and as long as temperatures average at or below normal, additional melting of Arctic sea ice will have its limitations. Meanwhile, the other nine months of the year in the Arctic region have consistently featured above normal temperatures in recent years. One possible explanation of this persistent temperature pattern in the Arctic region featuring nearly normal to below-normal summertime conditions and warmer-than-normal weather during the coldest nine months of the year is increased levels of water vapor in the atmosphere.
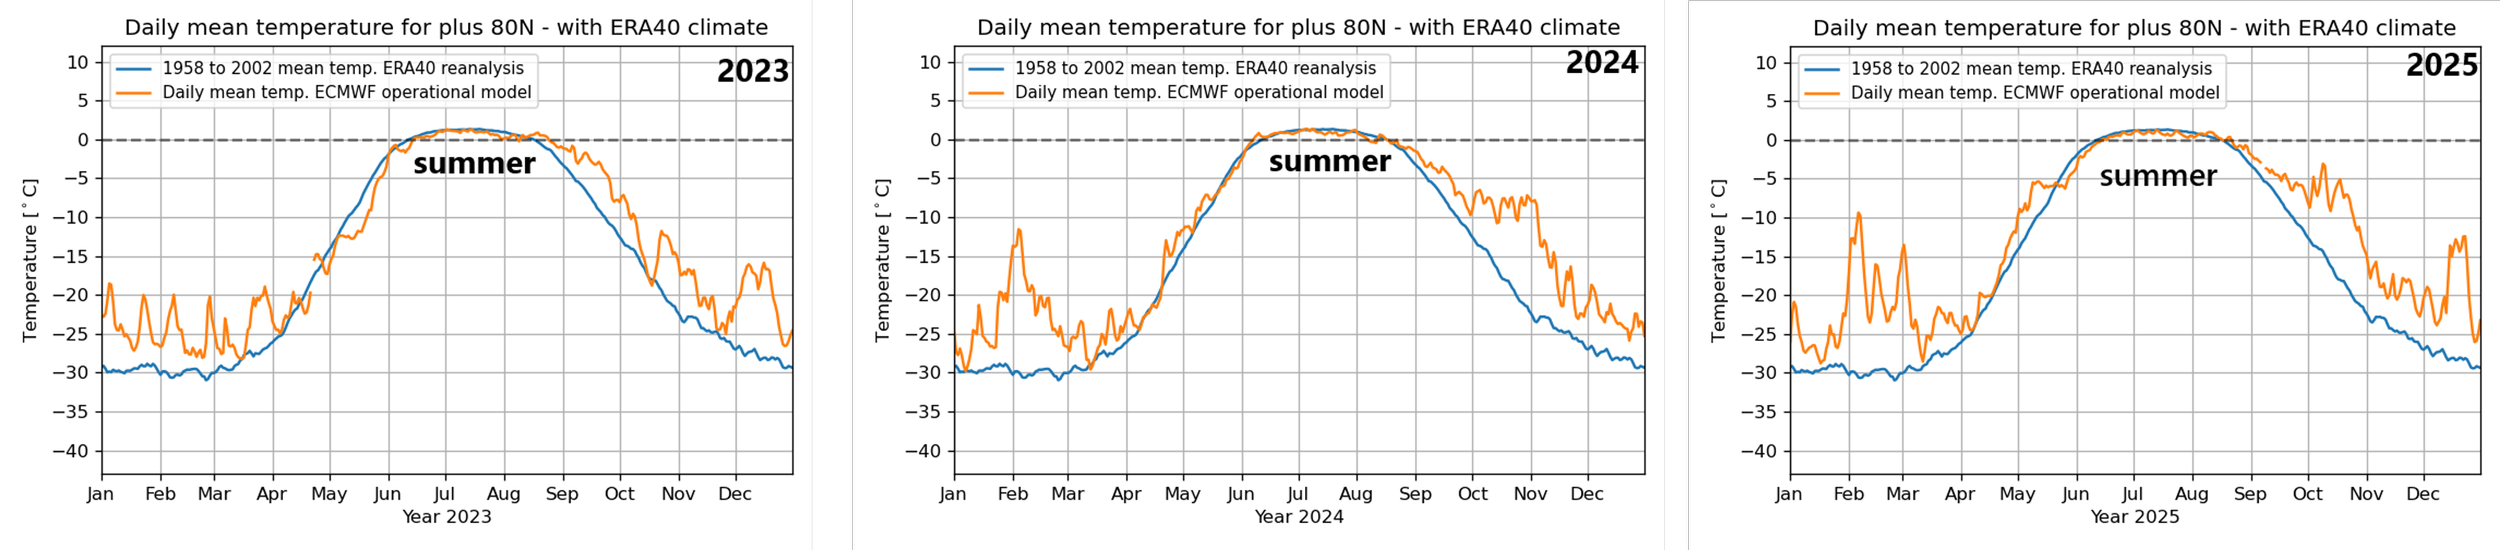
The temperature pattern in the Arctic region during the last three years has featured nearly normal levels during the summer (melting) season of June, July, and August, and above-normal conditions during the other (coldest) nine months of the year. In fact, this kind of annual temperature pattern in the Arctic region has been quite consistent since the turn of the century. Data courtesy Danish Meteorological Institute
Arctic temperatures and the impact on sea ice
Temperatures have followed a persistent trend in the Arctic region during the past several years, in fact, this pattern has persisted going all the way back to the beginning of the 21st Century. Specifically, temperatures have been running at or below normal levels during the all-important summer (melting) season of June, July, and August, and at well above-normal levels during the remaining nine (cold) months of the year. It is the temperatures in the summer months, however, which are most important when it comes to Arctic sea ice extent as this is the melting season up in that part of the world. Nearly normal temperatures in the Arctic’s summer season are typically around the freezing mark and, as long as they remain there during the melting (summer) seasons, chances of any additional significant drop-off in Arctic sea ice will be limited. Well above-normal temperatures in the other nine (cold) months of the year have a minimal impact on the melting of Arctic sea ice as they are typically well below the freezing mark. Indeed, with this dependable temperature trend in recent years, Arctic sea ice has been rather resilient both in terms of extent and volume, going back at least a decade or so.
Graph showing monthly Arctic sea ice extent since January 2000. The area covered by sea ice is defined as having at least 15% sea ice cover. The thin blue line shows monthly values, and the thick blue line shows the simple running 37-month average with consistent levels during the past decade or so showing some resiliency in Arctic sea ice. The red (horizontal) line shows the 1979-2024 average of Arctic sea ice. Data provided by the National Snow and Ice Data Center (NSIDC). Last month shown: May 2026. Latest figure update: 10 June 2026.
Atlantic Multidecadal Oscillation (AMO) and Atlantic Ocean temperatures
Arctic sea ice extent has been running at below-normal levels since the middle 1990’s at which time there was an important shift in the Atlantic Multidecadal Oscillation (AMO) to one featuring warmer-than-normal sea surface temperatures in the North Atlantic Ocean. Interestingly, portions of the Atlantic Ocean have cooled significantly during the past year or so and cooler-than-normal water in the Main Development Region of the tropical Atlantic may have an important impact on the tropical season (inhibits tropical storm development or intensification).
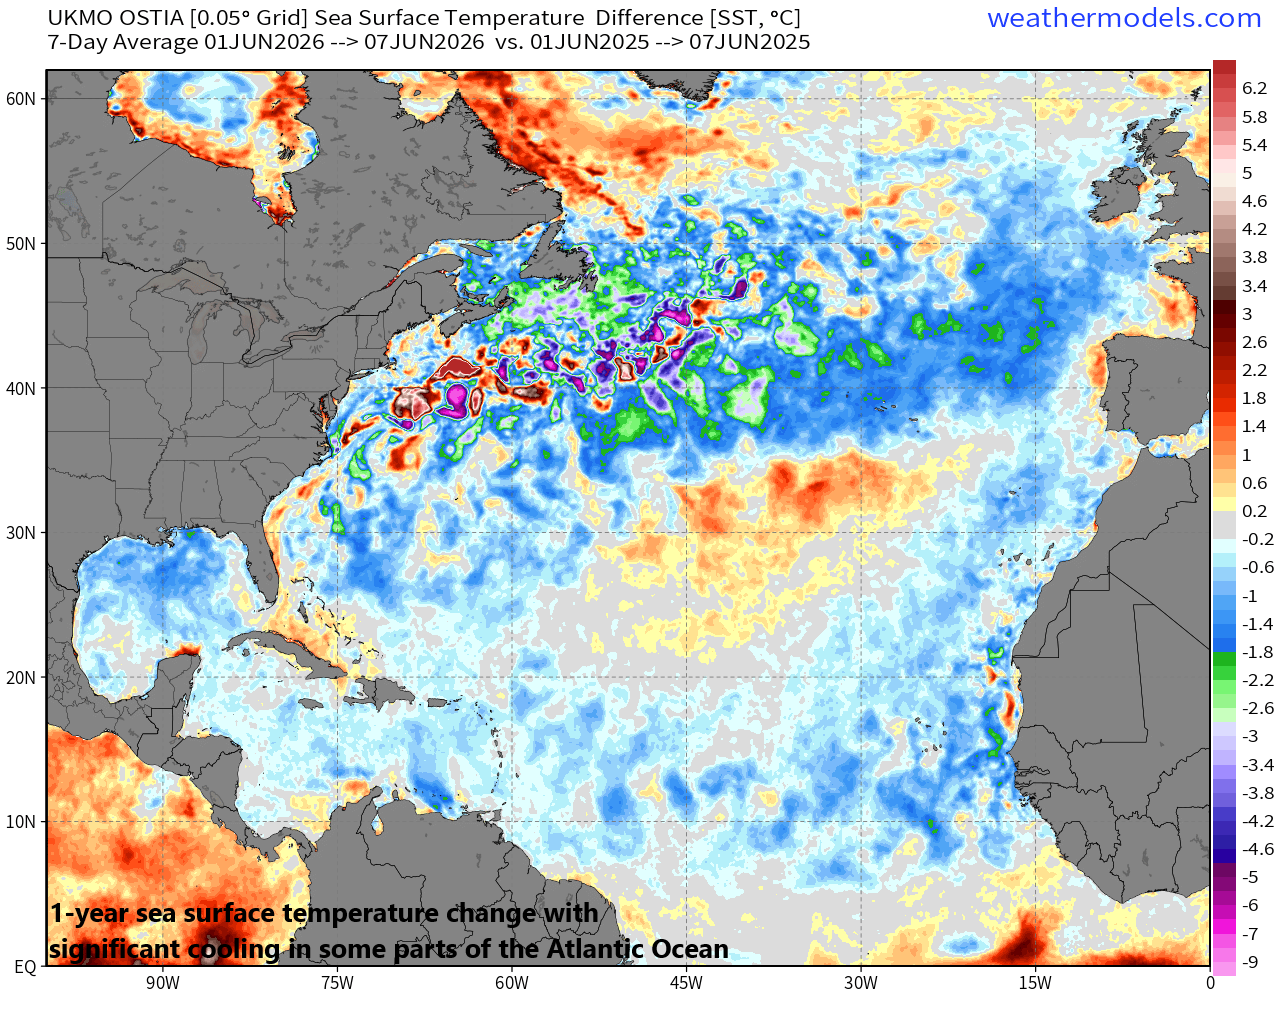
Water temperatures have dropped quite noticeably in portions of the Atlantic from a year ago and cooler-than-normal conditions in the Main Development Region of the tropical Atlantic can have a limiting effect on tropical activity. Map courtesy NOAA, Dr. Ryan Maue, X, weathermodels.com
The Arctic sea ice extent headed steadily downward after that AMO shift and reached its lowest point in 2012 at levels not seen before during the satellite era which goes back to the late 1970’s. Since then, however, Arctic sea ice extent has held rather steady with a general sideways trend during the past decade or so. Some recent studies confirm the “resiliency” seen during recent years in Arctic sea ice extent and have found that it not only has been detected during the month of September - the time of annual minimum - but has been evident in each and every other month of the year. Perhaps the cooling of portions of the North Atlantic and historically cold start to the summer season in the Arctic region is a signal that the AMO is about to transition from its “positive” phase to “neutral” or “negative” in the months and years to come...something we’ll monitor closely at arcfieldweather.com.
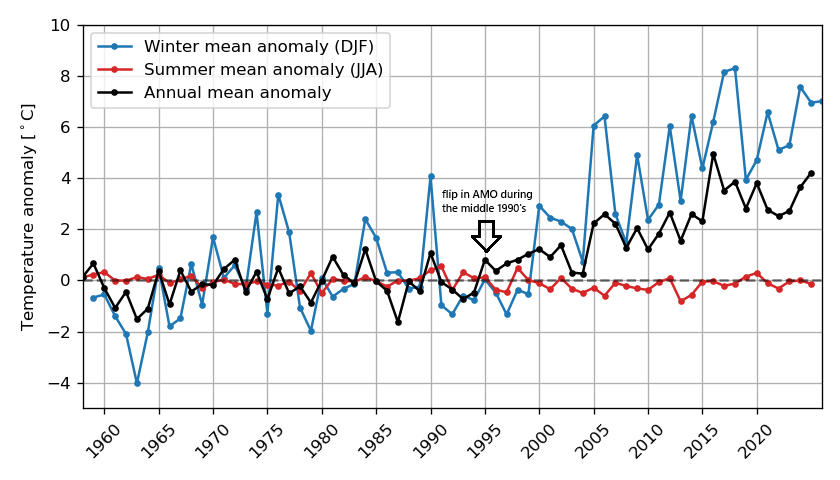
Anomaly of the +80N mean temperature index is shown here back to 1960, compared with climate (annual mean minus the corresponding climate value). The “Winter mean” (blue) and “Annual mean” (black) anomalies have steadily climbed since the middle 1990s. The “Summer mean” (red) anomaly, however, has held steady at nearly normal levels since 1960 and this is the critical melting season in the Arctic region. An important shift in the Atlantic Multidecadal Oscillation (AMO) took place during the middle 1990’s (indicated by arrow) when it flipped from a “negative-to-positive” phase. Perhaps the historically cold start to this summer season in the Arctic region is a signal that the AMO is about to transition from its “positive” phase into “neutral” or “negative”. Reference climate is ECMWF-ERA40 1958-2002. Plot courtesy Danish Meteorological Institute
The possible important role of water vapor
The somewhat strange behavior of the temperatures in the Arctic region in recent years with at or below normal summer seasons, and the warmer-than-normal conditions during the other (coldest) nine months of the year suggests to me that water vapor may be playing a key role. Water vapor content has increased on average around the world during the past couple of decades largely as the result of warmer-than-normal sea surface temperatures in both the North Atlantic (positive AMO) and the Pacific Ocean (multiple El Nino events). Warmer-than-normal water temperatures lead to increased evaporation and this, in turn, results in higher water vapor content in the atmosphere.
A key point here is that an increase in water vapor will have a bigger impact on temperatures in very cold and dry environments and less impact on warmer and more humid atmospheres. In other words, if water vapor is indeed increased throughout the world, the impact on temperatures in the tropics - where it is warm and humid throughout the year - would be quite small compared to its impact in the Arctic region. And in the Arctic region, an overall increase in water vapor content would have a much bigger impact on temperatures in the coldest nine months of the year when it can be extremely cold and dry as compared with the typically warmer and more humid summer (melting) season…all leading to the somewhat odd temperature pattern that we have seen in the Arctic region in virtually all years since the turn of the century.
Meteorologist Paul Dorian
Arcfield
arcfieldweather.com