Contact Us

Use the form on the right to contact us.

You can edit the text in this area, and change where the contact form on the right submits to, by entering edit mode using the modes on the bottom right. 


123 Street Avenue, City Town, 99999

(123) 555-6789

email@address.com


You can set your address, phone number, email and site description in the settings tab.
Link to read me page with more information.

backlit-stratus-clouds-2013-04-05.jpg

Blog

Weather forecasting and analysis, space and historic events, climate information

Filtering by Category: Climate Info

9:30 AM | Global sea ice fights its way back to near normal after sharp drop earlier this year

Paul Dorian

Overview

Strong El Nino conditions continue to exist in the tropical Pacific Ocean as we approach the end of 2015 and this natural oceanic phenomenon ranks as one of the three strongest during the past 50 years.  In fact, this El Nino (warmer-than-normal sea surface temperatures) is likely near its peak intensity level and it has already had major ramifications around the world.  For example, global temperatures have spiked to well above-normal levels and this temperature pattern is likely to continue well into 2016.  By late 2016, however, it is looking more and more likely that El Nino will completely reverse into La Nina (colder-than-normal) conditions and – if history is any guide - global temperatures are then likely to drop sharply. 

In addition to its impact on global temperatures, the on-going strong El Nino event in the tropical Pacific Ocean has no doubt played some role in the sharp drop of global sea ice extent in recent months despite the fact that it is far removed from the polar regions.  However, as we approach the end of the year - and despite the continuing strong El Nino event - global sea ice has actually fought its way back to near-normal levels – much as it was during the past couple of years.

red line represents global sea ice areal extent compared to the 1979-2008 normal as represented by the “zero” line; data courtesy University of Illinois "cryosphere"; NOAA/NCEP Snow and Ice Data Center

red line represents global sea ice areal extent compared to the 1979-2008 normal as represented by the “zero” line; data courtesy University of Illinois "cryosphere"; NOAA/NCEP Snow and Ice Data Center

Southern Hemisphere

After soaring to near record high levels during the past couple of years, sea ice in the Southern Hemisphere dropped sharply recently in areal extent from way above-normal amounts to below-normal levels.  That drop to below-normal, however, has not lasted too long.  In the past several weeks, sea ice has actually increased in areas surrounding the continent of Antarctica relative-to-normal and it is now once again running at above-normal levels (plot below), but not nearly as high as it was about one year ago.  Southern hemisphere sea ice recently stayed above-normal for a period of more than three years, from 2012 to 2015. This is something that had never happened before during the satellite period dating back to 1979. 

Southern Hemisphere sea ice anomaly since 1979; data courtesy University of Illinois “cryosphere”

Southern Hemisphere sea ice anomaly since 1979; data courtesy University of Illinois “cryosphere”

Northern Hemisphere

The northern hemisphere sea ice areal extent is still below-normal relative to all years going back to 1979 although it is well above the lowest point set during 2012 - and even above levels seen earlier this year. The northern hemisphere sea ice areal extent is currently 742,000 square kilometers below the mean using the base period of 1979-2008 for comparison (plot below). The northern hemisphere sea ice areal extent has leveled off in the past 10 years or so at below-normal levels after dropping consistently from the mid 1990’s to the middle of the last decade. In the time period before the mid 1990’s, the sea ice areal extent was generally above-normal dating back to 1979. 

Northern Hemisphere sea ice anomaly since 1979; data courtesy University of Illinois “cryosphere”


The directional shift in the sea ice areal extent trendline that developed during the mid-1990’s in the northern hemisphere correlates quite well with a northern Atlantic Ocean sea surface temperature cycle that is tracked by meteorologists through an index called the Atlantic Multidecadal Oscillation (AMO). Indeed, Atlantic Ocean sea surface temperature anomalies play a critical role in the overall northern hemisphere sea ice areal extent. The AMO index flipped in phase during the mid-1990’s from negative (cold) to positive (warm) and the sea ice areal extent trendline changed direction right around that point in time.

The Atlantic Ocean is just recently showing signs of a long-term temperature phase shift back to cold and if that trend continues over the next couple of years then the northern hemisphere sea ice areal extent is quite likely to return to the same above-normal levels that were seen prior to the mid 1990’s. (Click here for more information on the potential significant long-term temperature phase shift in the Atlantic Ocean: http://vencoreweather.com/2015/03/22/1230-pm-the-atlantic-ocean-is-showing-signs-of-a-possible-significant-long-term-shift-in-temperatures-from-warm-to-cold/). 

In fact, the northern hemisphere sea ice has actually shown great resiliency in recent years and has rebounded to the highest levels seen during the past ten years according to recent data from the Danish Meteorological Institute (plot below, http://ocean.dmi.dk/arctic/old_icecover.uk.php ).

Northern hemisphere sea ice extent for 2015 (black line); Note - the sea ice extent here is calculated with the coastal zones masked out.

Northern hemisphere sea ice extent for 2015 (black line); Note - the sea ice extent here is calculated with the coastal zones masked out.


Meteorologist Paul Dorian

Vencore, Inc.

11:00 AM | Signs for colder weather as we progress through second half of December

Paul Dorian

The first week of December was quite mild in the I-95 corridor with temperatures averaging 6.5 degrees above normal in Philadelphia, 6.2 degrees above normal at Central Park in New York and 3.1 degrees above normal at Reagan National Airport in Washington, D.C.  This week also looks relatively mild with high temperatures likely reaching or even exceeding the 60 degree mark in parts of the region by this weekend.  Looking ahead, however, there are signs that the upper atmosphere pattern will change to allow for more normal cold to arrive as we progress through the second half of December.

Read More

3:00 PM | Mount Etna erupts and lights up the skies in Sicily, Italy

Paul Dorian

Mount Etna is the largest volcano in Europe and one of the most active volcanoes in the world.  On Thursday morning, December 3rd, southern Italy woke up to see an eruption after two years of silence.  Scientists say it was the most violent eruption from the volcano in the past two decades.  The intense eruption exploded from Etna’s Voragine crater with ash reaching as high as 10,000 feet into the atmosphere and a fountain of lava as high as 5000 feet.  High level winds pushed ash over villages in Sicily and other portions of southern Italy.  Volcanic lightning was also seen above Mt Etna on Thursday during the eruption period which lasted less than an hour.  The Voragine crater was formed inside of the central crater in 1945 and is among three other craters in the volcano: Bocca Nuova, the crater of the Northeast, and the crater of the Southeast which is said to be the most active one.  

Read More

9:00 AM | Another down year in the US for hurricanes and tornadoes

Vencore Weather

More good news this year for the nation on the extreme weather front as it has been another down year in terms of hurricanes and tornadoes. The Atlantic Basin hurricane season officially ends tomorrow, December 1st, and it is quite likely safe to say that this will be another below-normal year in the US for land falling tropical storm activity. In fact, the US has not been struck by a major hurricane (category 3, 4 or 5) in slightly more than ten years and this is the longest drought of that kind since record-keeping began in 1851. In addition, 2015 is turning out to be another below-normal year for tornadoes across the nation and this too continues a trend that is a decade in the making.

Read More

12:40 PM | *Soaking rain event on Thursday to be followed by cold blast for the weekend…coldest weather so far for Sunday and Monday...looking ahead to Turkey Day*

Paul Dorian

storm.png

[Today's satellite image of major storm that is headed into the eastern US; courtesy NASA, Capital Weather Gang]

Discussion

Thursday rain event

A powerful storm system that currently extends from Mexico to Canada is headed towards the eastern US and it will produce a significant rain event for much of the region on Thursday (satellite image above). This is the same storm system that produced heavy snow and winter cold in Colorado and Kansas earlier in the week as well as tornadoes in its warm sector across parts of the central US. The rain is likely to arrive here late tonight and continue through the morning and it could very well have a negative impact on the morning commute in DC, Philly and perhaps even New York City (could hold off there until just afterward rush hour). The winds will be quite gusty tomorrow ahead of a strong cold front and there can be an isolated thunderstorm or two during this upcoming event.

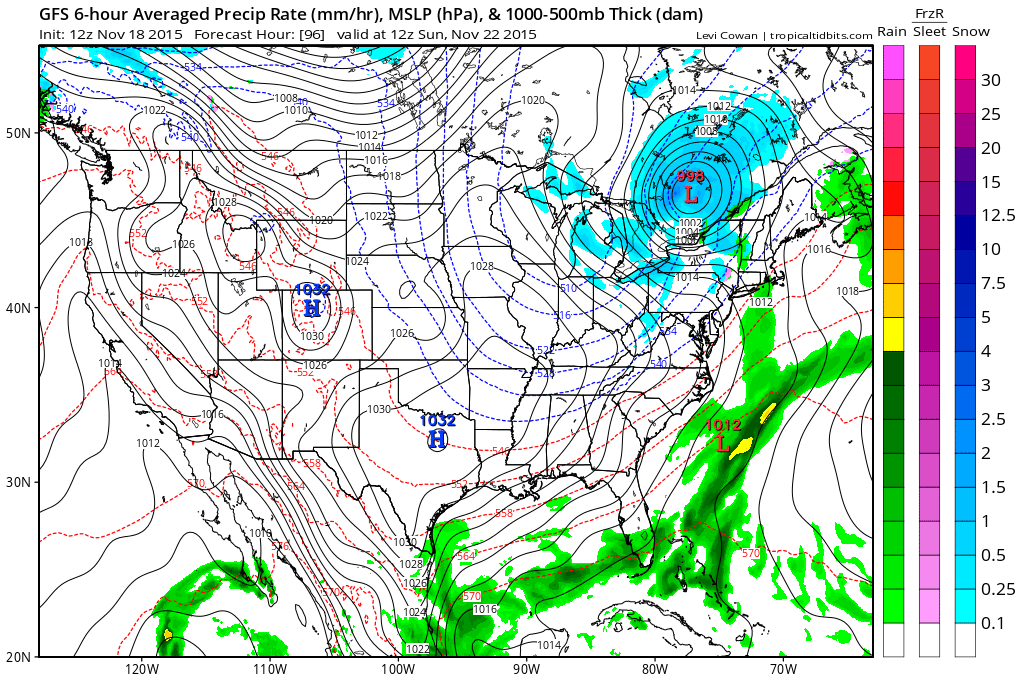
sun_am_fcst_map.png

[12Z GFS surface forecast map for Sunday morning (blues=snow); courtesy NOAA, tropicaltidbits.com]

Progressively colder Friday, Saturday and Sunday

This significant rain event will be followed by a colder air mass in the Mid-Atlantic region to close out the work week on Friday, but this will be just the first "step-down" in temperatures in coming days. Another storm system will move quickly from the Rockies this weekend and head towards the Great Lakes region likely producing the first accumulating snow of the season in places like Chicago, Detroit and Madison. This next storm will slide a secondary cold front through here on Saturday night and the coldest air mass of the season will arrive on Sunday. In fact, Sunday promises to be the coldest day of the season so far and snow flurries/snow showers are not out of the question across portions of the Mid-Atlantic and Northeast US (forecast surface map above; blue=snow). Well-below normal temperatures will remain stuck in place across the eastern US on Monday as we begin the new work week (temperature anomaly forecast map below).

mon_am_temps.png

[12Z GFS temperature anomaly forecast map for Monday morning; courtesy NOAA, tropicaltidbits.com]

Looking ahead to Turkey Day and beyond

While still chilly next Tuesday, it is likely that the second half of next week will see a turn to milder conditions in the eastern US following this weekend’s cold blast and before another cold blast arrives late in the weekend following Thanksgiving Day. This next cold blast which will arrive near the end of November is likely to be even colder than this weekend’s outbreak.

10:00 AM | Heavy rain event on Thursday triggers pattern change to noticeably colder

Paul Dorian

days1-5.png

[00Z GFS Ensemble 2-meter temperature anomaly forecast map for days 1-5; courtesy NOAA, "tropicaltidbits.com"]

Discussion

Near term

So far the month of November has been well above normal in the Mid-Atlantic region (Philly +7.1°, DCA +5.0°, NYC +6.4°), but it looks like the overall mild pattern is going to change noticeably to colder for the last ten days of the month and perhaps right even into early December and all of this is going to be triggered by a heavy rain event on Thursday. After a mild day to start the work week, there will be a temporary setback in the mild temperatures on Tuesday as a back door cold front slides southward through the Mid-Atlantic region during the overnight hours. High temperatures on Tuesday afternoon will be some ten degrees cooler than what is expected later this afternoon. Milder air pushes northward again on Wednesday and Thursday riding in on increasingly strong south-to-southwest winds and a strong cold front will be approaching from the west. Heavy rain is likely from the cold frontal system late Wednesday night and Thursday in the I-95 corridor and this event will trigger the temperature pattern change to colder beginning by this upcoming weekend.

days6-10.png

[00Z GFS Ensemble 2-meter temperature anomaly forecast map for days 6-10; courtesy NOAA, "tropicaltidbits.com"]

Longer term

Last night’s GFS Ensemble run at 00Z shows nicely the changes that are coming not only here to the Mid-Atlantic region for the last ten days of the month, but also to much of the nation as well. The first map (top) shows the overall temperature anomalies across the US for days 1-5 (16NOV-21NOV). Warmer-than-normal conditions (oranges) dominate in the eastern US with mainly colder-than-normal (blues) weather out west during this current 5-day stretch. Beyond that, the 6-10 day (21NOV-26NOV) temperature anomaly forecast map (middle) shows big changes in the Mid-Atlantic region with colder-than-normal (blues) conditions and it is similarly cold throughout most of the nation away from the southwestern states. Does the cold hold beyond that time period? The 11-15 day (26NOV-01Dec) temperature anomaly forecast map (bottom) indicates it certainly will with colder-than-normal weather continuing in most of the nation right from Thanksgiving into the beginning of December. As far as snow is concerned, there are signs for some threats in the Northeast US in the weekend after Thanksgiving or the early part of December and we’ll monitor those chances in the days ahead.

days11-15.png

[00Z GFS Ensemble 2-meter temperature anomaly forecast map for days 11-15; courtesy NOAA, "tropicaltidbits.com"]

11:40 AM | El Nino should completely reverse in a year or so

Paul Dorian

cdas-sflux_ssta_global_1.png

[Current SST anomalies with El Nino region circled; data courtesy NOAA, map courtesy "tropicaltidbits.com"]

Overview

El Nino conditions developed last year in the equatorial part of the Pacific Ocean and they have intensified significantly in the past several months. In fact, it appears that this El Nino will end up rivaling in strength the comparable events of 1972-1973, 1982-1983 and 1997-1998. This type of natural phenomenon features warmer-than-normal sea surface temperatures in the tropical Pacific Ocean while its counterpart called La Nina is associated with colder-than-normal waters. Given the fact that the Pacific Ocean is by far the world’s largest, it is not surprising that an El Nino of this magnitude is having major ramifications around the world and it will continue to do so for the next several months. Indeed, this El Nino is quite likely to play an important role in the upcoming winter around here in the Mid-Atlantic region: http://vencoreweather.com/2015/10/14/400-pm-2015-2016-winter-outlook-for-the-mid-atlantic-region/. There are some indications that the peak of this current El Nino episode will occur over the next month or two and then it’ll begin to weaken during the early part of 2016. In fact, there are some computer model forecasts that suggest this strong El Nino will completely reverse in a year or so to strong La Nina conditions and this too would have significant consequences around the world.

SST Anomalies

In the past few months, warmer-than-normal sea surface temperature anomalies (circled orange area in above plot) have spread westward from the west coast of South America into the central equatorial Pacific Ocean. Computer forecast models are in general agreement that this strengthening trend in the El Nino will reach its peak over the next couple of months and then there will be weakening next year. The effects of the current strong El Nino have already been appearing in numerous ways around the world. To begin, the added warmth to the sea surface temperatures in the Pacific Ocean has helped to fuel a very active tropical season in that part of the world. In addition, the Atlantic Basin has actually experienced a below-normal tropical season which is often the result of an El Nino as it tends to increase wind shear across the tropical Atlantic Ocean which, in turn, inhibits tropical storm formation.

Global temperatures

In addition to its impact on tropical storm activity, El Nino tends to generate a spike in global temperatures. The plot below of global temperature anomalies is produced by NOAA’s CFSv2 model and the circled areas show the spikes in global temperatures associated with recent El Nino events of 2006-2007 and 2009-2010 as well as the jump caused by the current episode. The spike associated with the current El Nino may continue for the next several months as there is often a lag in the effects of El Nino well past the actual peak in sea surface temperature anomalies. In other words, even if El Nino begins to weaken during early 2016, a residual “warming” effect can still show up for awhile with respect to global temperature anomalies. One other important point to make regarding the global temperature anomaly pattern that is related to El Nino is that in each of the recent El Nino events of 2006-2007 and 2009-2010, global temperatures dropped sharply in subsequent months following the El Nino.

global_temps_2005_to_OCT09_2015.png

[NOAA CFSv2 global temperature anomalies; courtesy Ryan Maue of Weather Bell Analytics]

Strong La Nina may be just a year away

Some computer forecast models are already predicting the demise of the current El Nino and, in fact, suggest a strong La Nina (colder-than-normal SSTs) will replace it by the end of next year. The plot below is a computer model forecast map from the Scripps Institution of Oceanography and it predicts there will be a strong La Nina event in a year or so in the same tropical region of the Pacific Ocean that is now experiencing well above-normal SSTs. As has been the case with the recent two El Nino events, a reversal like this would quite likely have serious ramifications on global temperatures. It would not be surprising to see another sharp drop in global temperatures once the current strong El Nino event fades away and La Nina conditions return to the tropical Pacific Ocean.

la-nina-forecast.png

[Scripps Institution of Oceanography forecast map of tropical Pacific Ocean SST anomalies during late 2016 (greens, blues are colder-than-normal water temperatures]

Paul Dorian

Vencore, Inc.

Valley Forge, PA

9:30 AM | Substantial increase in Siberian snowpack...bodes well for some cold, snow around here

Paul Dorian

Picture11.png

[Increase in October snowpack across Siberia (white=snowcover, yellow=ice); courtesy US National Ice Center/NOAA]

Discussion

One of the key reasons provided in the mid-month release of Vencore Weather’s “Winter Outlook” (http://vencoreweather.com/2015/10/14/400-pm-2015-2016-winter-outlook-for-the-mid-atlantic-region/) for the expectation of a snowy winter in DC, Philly and NYC had to do with the fact that there were numerous favorable signs for “high-latitude blocking” this upcoming winter. “High latitude blocking” is an atmospheric phenomenon that can be tracked by meteorologists through an index called the Arctic Oscillation (AO) and it often leads to cold air outbreaks in the Northeast US (usually with a negative index value). Studies have shown that an increase in snowpack across Siberia during the month of October – specifically in areas south of 60°N – is pretty well correlated with persistent negative AO index values in subsequent winter months and “high latitude blocking” events (http://web.mit.edu/~jlcohen/www/papers/Gong_JC03.pdf). This in turn is often correlated with cold air outbreaks in the Northeast US which, of course, is a necessary requirement around here for snow. Indeed, the snowpack across Siberia has increased dramatically from the beginning of October to now – even in those areas south of 60°N. In fact, there are reports that in just the last three days the Siberian snowpack has increased by over 2 million square kilometers (source WxRisk.com).

10_28_NH.png

[Current Northern Hemisphere snowpack (brown=snowcover); courtesy Rutgers Snow Lab]

The top figure compares the snow cover (white region) across Siberia from the end of September to today’s level. There has been a steady increase in snowpack in Siberia over the past few weeks from the mainly snow-free grounds at the beginning of the month. In addition to northern Canada and Greenland, Siberia can be a crucial cold air source for the northeastern states during any given winter season. It is not uncommon for an air mass to build up over a several day period in the wintertime over a snow-packed Siberia and then have it make a move across the North Pole into northern Canada and then eventually into the northern US. The second figure above displays a current view of the snow pack across the Northern Hemisphere and - in addition to Siberia - northern Canada and Greenland are now well covered by snow (brown region; data courtesy Rutgers Snow Lab). (One final note, there is an unofficial report of the lowest October temperature ever recorded in Greenland on 10/24 at -67.72°F).

12:45 PM | Study shows hurricanes in global downward trend during last 25 years

Paul Dorian

ACE.png

Overview

Whether these findings are part of normal "year-to-year" variability or indeed part of a long-term trend, the results of a new study are quite interesting. Philip Klotzbach (Department of Atmospheric Science, Colorado State University) and Christopher Landsea (NOAA/NWS/National Hurricane Center) have just published the results of a study in which they conclude shows “large, significant downward trends” in Accumulated Cyclone Energy in the Northern Hemisphere, the Southern Hemisphere and globally during the 25-year period of 1990-2014. In addition, the study has found “small, insignificant” trends in intense (category 4-5) hurricane frequency and percentage in the same 25-year period on a global basis. The results of this study have been published in the October edition of the Journal of Climate: http://journals.ametsoc.org/doi/abs/10.1175/JCLI-D-15-0188.1).

Accumulated Cyclone Energy (ACE)

Accumulated Cyclone Energy (ACE) is a commonly-used metric for tropical activity because it is not dependent on exact numbers of named storms or hurricanes, but rather is based on both the intensity and longevity of all tropical storms and hurricanes (so a long-lived tropical storm could contribute as much ACE as a short-lived storm that reached hurricane intensity). The figure below from the Klotzbach and Landsea journal article displays the ACE levels for the 45-year period from 1970 through 2014. The top half of the figure displays ACE by year for each of the six global tropical cyclone basins since 1970. These values are combined into hemispheric and global sums in the bottom half of the figure. There has generally been a decreasing trend in ACE since the early 1990s when a prolonged El Nino event enhanced activity in the North Pacific.

paper-ACE.png

[Accumulated Cyclone Energy (ACE) 1970-2014; courtesy Klotzbach and Landsea (1 October 2015, Journal of Climate)]

This year’s tropical activity

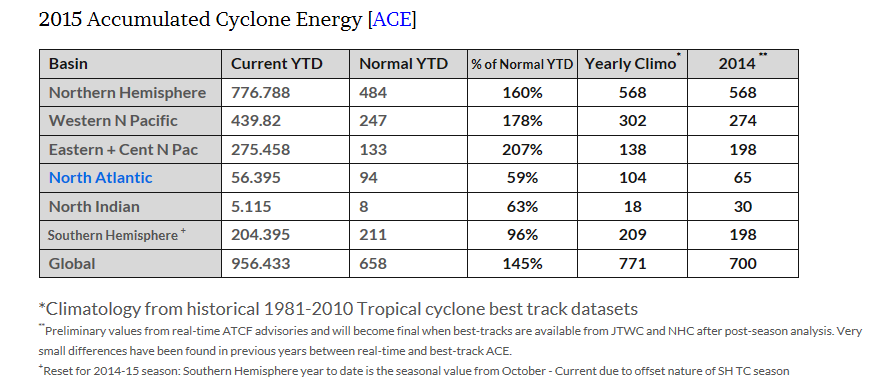
In terms of ACE for 2015, it has been very active in the Pacific Ocean aided in large part by a strong El Nino event (warmer-than-normal water) in the tropics. Indeed, the ACE values are well above normal in both the western North Pacific and the eastern/central North Pacific (table below; data courtesy Ryan Maue of Weather Bell Analytics; http://models.weatherbell.com/tropical.php). On the other hand, the Atlantic Ocean has actually been below normal with respect to ACE and that is partly due to the same El Nino event that has helped to fuel Pacific Ocean tropical storms. Evidence shows that in El Nino years, there is an added level of wind shear in the tropical Atlantic Ocean which tends to inhibit tropical storm formation. The downturn in Atlantic Basin tropical activity during 2015 has helped keep alive a 10-year drought in the US with respect to major hurricane (categories 3, 4 and 5) strikes. In fact, we have just passed the 10-year anniversary for the last major hurricane landfall in the US (Wilma in Florida, October 2005) which is the longest drought ever logged in the record-keeping era.

ACE.png

[2015 Accumulated Cyclone Energy (ACE) on a global basis; data courtesy Ryan Maue, Weather Bell Analytics]

Looking ahead to the tropics

There is a word of caution for the US, however, as this year’s strong El Nino event in the tropical Pacific Ocean is quite likely to weaken during 2016 and the “beneficial” effect of higher-than-normal wind shear in the Atlantic Basin is likely to diminish by next summer potentially leading to an uptick in activity. In fact, this potential increase in Atlantic tropical activity next year could even extend into 2017 as La Nina conditions (colder-than-normal waters) are quite possible by that time in the tropical Pacific Ocean. Meanwhile, it is entirely possible that at the same time the Atlantic Ocean tropical activity potentially increases during the next couple of years, the Pacific Ocean could experience somewhat quieter conditions compared to today as sea surface temperatures drop relative-to-normal with the gradual demise of El Nino.

11:15 AM | *Category 5 Hurricane Patricia to slam Mexico later today*

Paul Dorian

vis.png

[Visible satellite image of Hurricane Patricia shortly after sunrise; courtesy NASA]

Discussion

Hurricane Patricia intensified explosively yesterday from a category 1 storm early in the day to a category 5 level by early today - perhaps reaching the strongest levels ever seen during the record-keeping era in the eastern Pacific Ocean in terms of central pressure (880 mb or 25.98 inches) and wind speeds (maximum sustained winds near 200 mph). It is likely to make landfall later today somewhere between Puerto Vallarta and Manzanillo with 185 mph wind gusts possible along with torrential rainfall.

Fueled by one of the strongest El Nino events since 1950, Patricia has become the 9th hurricane in the eastern Pacific to achieve at least category 4 or 5 intensity, which is the most during the record-keeping era. The storm has been able to achieve incredible intensification by developing over some of the warmest ocean temperatures in the Northern Hemisphere, over 86 degrees. In fact, the “boxed-in” region on the sea surface temperature plot (below) has water temperatures that average 1°C higher than at any time in the last 34 years (source: Ryan Maue of WeatherBell Analytics).

SST.png

[Sea surface temperature analysis of eastern Pacific Ocean region (dark brown region is 86-87 degrees F); source Weather Bell Analytics]

According to the National Hurricane Center, early this morning Patricia became the strongest hurricane recorded for the eastern Pacific and Atlantic Ocean. The estimated central pressure of Patricia dropped to 880 mb, breaking the record of 894 mb from Hurricane Linda in the eastern Pacific set in 1997 and also surpassing the 882 mb pressure of Hurricane Wilma in the Atlantic from 2005. The maximum sustained winds of 200 mph (160 knots) breaks the previous wind speed record from Linda and Wilma (185 mph) for the strongest surface winds ever in the area of responsibility of the National Hurricane Center.

Slide12.jpg

[Colorized IR image of Hurricane Patricia from early today; courtesy NOAA, NASA]

While significant weakening will occur after the center of Patricia heads inland, copious amounts of moisture will head northeastward across Mexico bringing flooding along its path this weekend. By late in the weekend, the remains of Hurricane Patricia will head into the Texas/Louisiana section of the Gulf coastal region in the US bringing heavy rains and strong winds. The moisture is then likely to get caught up in a frontal system early next week across the Mississippi and Ohio Valleys and it could generate widespread heavy rainfall and even a significant severe weather outbreak. By the middle of next week, this system and its moisture field will likely arrive in the Mid-Atlantic region.

Video

httpv://youtu.be/Teq0obGyDJs


Paul Dorian

Vencore, Inc.