
11:30 AM | Major temperature pattern flip to colder likely coming to the Mid-Atlantic region by mid-to-late November
Paul Dorian

Widespread colder-than-normal conditions during the month of October across Eurasia; map courtesy Weather Bell Analytics at weatherbell.com
Overview
September was well above normal in the Mid-Atlantic region (PHL +4.4°, DC +5.0°, NYC +3.8°), October turned out above-normal as well (PHL +2.9°, DC +3.6°, NYC +1.9°); however, there are signs for a major temperature pattern flip during the middle and latter parts of November that will bring dramatic changes to the DC, Philly and NYC metro regions. In fact, this expected upcoming pattern flip to colder that was discussed in detail in the recently posted Vencore Weather Winter Outlook, may very well stick around for awhile and lead us right into a colder-than-normal winter season in the Mid-Atlantic region. The month of December is likely to be a far cry from the unusually warm weather that we experienced a year ago and the period from Thanksgiving-to-Christmas could be very interesting indeed.

Widespread snowpack (in white) across Siberia as the month of November begins; courtesy NOAA
Eurasia cold
In the Vencore Weather Winter Outlook, one of the key factors cited in the expectation for colder-than-normal weather conditions around here this winter was the increasing snowpack across places like Siberia during the month of October. An increasing snowpack to above-normal levels in October in Siberian regions south of 60°N has been correlated quite well with a negative Arctic Oscillation index in subsequent winter months and this, in turn, often results in cold air outbreaks into the eastern US. In fact, this increasing snowpack across Siberia has been associated with much colder-than-normal weather across a widespread area of Europe and Asia during the month of October (above). Just this week, for example, record-breaking cold swept through northern China with some towns recording their lowest October temperatures since records began there in 1951. History has shown that this kind of extensive cold often finds itself on the other side of the north pole in subsequent weeks.
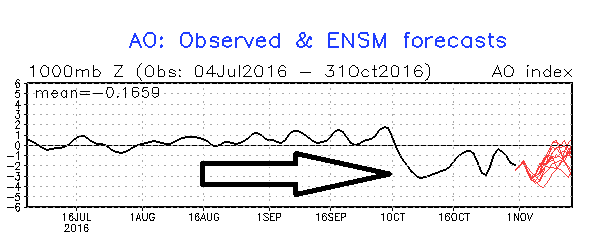
Arctic Oscillation index value (current, past in black, forecast in red); courtesy NOAA/CPC
Arctic Oscillation
Meanwhile, at the same time this colder-than-normal air was gripping Eurasia, the Arctic Oscillation (AO) index was tanking into negative territory and recent model forecasts keep it on the negative side well into November. This index was running along for several months at neutral to slightly positive levels until around the first of October. Since then, the AO index has been consistently on the negative side and this is often a good predictor for high-latitude blocking patterns to form which, in turn, often results in cold air outbreaks for the eastern US.
High-latitude blocking is tracked by meteorologists through this particular index and also its closely-related cousin called the North Atlantic Oscillation (NAO). The Arctic Oscillation refers to opposing atmospheric pressure patterns in middle and high latitudes. When the AO is positive, for example, surface pressure is low in the polar region and this helps the mid-latitude jet stream to blow strongly and consistently from west-to-east keeping Arctic air locked up in the polar region. When the AO index is negative, there tends to be high pressure in the polar regions (i.e., high-latitude blocking), weaker zonal winds, and greater movement of polar air into the middle latitudes such as the Mid-Atlantic region.

500 mb height anomalies in the current 5 day period; map courtesy tropicatidbits.com, NOAA
Computer forecast models
The ensemble run of the 00Z Canadian computer forecast model is picking up on the potential flip in the temperature pattern across the eastern US for the middle or latter part of November and this potential change is likely to become even more pronounced in upcoming model runs. The latest 5-day average forecast maps of 500 millibar height anomalies show a dramatic change from the current high pressure ridging (warmer-than-normal, oranges) across much of the US to low pressure troughing by the middle of November (colder-than-normal, blues). The GFS computer forecast model is not quite as dramatic with the potential change as is the Canadian forecast model, but that will likely change over the next few GFS model runs. Once this colder-than-normal pattern sets up in the eastern US, it is likely to stick around for awhile. Additionally, given the current warmer-than-normal water temperatures of the Great Lakes, a switch to below-normal air temperatures by the middle of November could very well set things up for some serious lake-effect snow events for those areas just downstream of the Great Lakes.

500 mb height anomalies in the days 12-16 time period; map courtesy tropicaltidbits.com, NOAA
Indeed, it could turn out to be quite an interesting time period around here from Thanksgiving to Christmas.
Meteorologist Paul Dorian
Vencore, Inc.
vencoreweather.com