
7:15 AM | *La Nina conditions continue across the equatorial Pacific…likely to last into at least early summer with a potential impact on tropical activity…seeing an impact on global temperatures*
Paul Dorian

Sea surface temperatures continue to run at colder-than-normal levels (shown in blue) in the equatorial part of the Pacific Ocean and La Nina is likely to last into at least the beginning part of the upcoming summer season. Map courtesy NOAA, tropicaltidbits.com
Overview
La Nina conditions have dominated the scene in the equatorial part of the Pacific Ocean for this winter season as it did for the prior winter season of 2020-2021. Numerous computer models suggest that these colder-than-normal sea surface temperatures in the tropical Pacific will last into at least the beginning part of the upcoming summer season. If so, La Nina may indeed have an impact on global tropical activity this summer as it did during the last tropical season in 2021. In addition to its impact on tropical activity in the Atlantic and Pacific Oceans, these back-to-back La Nina episodes have seemingly affected global temperatures during the past many months which have dropped to nearly normal levels in the latest monthly reading.

This plot shows forecasts made by dynamical and statistical models for sea surface temperature (SST) anomalies in the “Nino 3.4” region (central Pacific) for nine overlapping 3-month periods. Many of the models suggest that the current La Nina episode will continue into at least the start of the upcoming summer season. Data source: IRI/CPC
Background
The Pacific Ocean is the largest on the planet, covers more than 30 percent of the Earth’s surface, and is bigger than the landmass of all the continents combined. The warm waters of the equatorial Pacific Ocean store a great amount of latent heat when compared to cooler waters and breed a great deal of convection which impacts downstream ridging and troughing in the atmosphere. As such, its sea surface temperature (SST) pattern has a tremendous influence on all weather and climate around the world and the more anomalous the sea surface temperatures, the more the impact can be on the atmosphere around the world. The El Nino-Southern Oscillation (ENSO) is a recurring climate pattern involving changes in the temperature of waters in the central and eastern tropical Pacific Ocean. El Nino and La Nina are the extreme phases of the ENSO cycle; between these two phases is a third phase called ENSO-neutral.
Weak-to-moderate La Nina conditions continue in the equatorial Pacific
During the winter season on 2020-2021, La Nina conditions (i.e., colder-than-normal water) persisted in the equatorial part of the Pacific Ocean and they then weakened to a nearly neutral state during the spring and summer of last year. New cooling then formed in the same part of the Pacific Ocean last fall and La Nina conditions strengthened in time for the still-ongoing winter season of 2021-2022. It is actually not all that unusual to have two La Nina events follow each other with eight of the twelve “first-year” La Nina events since 1950 followed by a second year episode during the subsequent winter season.

The accumulated cyclone energy (ACE) is the best measure of overall tropical activity and it was below-normal for the 2021 season across the entire Northern Hemisphere (boxed in value at lower right where 430.5 is actual and 543.7 is normal). While the Atlantic Basin experienced above-normal ACE, the Pacific Ocean more than offset this with far less activity compared to normal; especially, when considering the number of “major” hurricanes. Data courtesy Colorado State University, NOAA
La Nina’s impact on global tropical activity
What goes on in the tropical Pacific Ocean with respect to ENSO does indeed have an effect on tropical activity in the Atlantic Basin. El Nino, which refers to warmer-than-normal waters in the equatorial Pacific Ocean, tends to be an inhibiting factor for tropical storm formation/intensification in the Atlantic Basin. First, El Nino tends to produce faster-than-usual high-altitude winds over the tropical Atlantic Ocean and this increase in wind shear (change of wind speed with height) is hostile to the development or maintenance of tropical storms. Second, El Nino tends to result in sinking motion over parts of the Atlantic Basin which also is hostile to tropical storm formation/intensification.

The El-Nino Southern Oscillation (ENSO) regions of the equatorial Pacific Ocean are often broken up into smaller sub-sections as labeled on this map (courtesy NOAA).
On the other hand, La Nina, which refers to colder-than-normal waters in the equatorial part of the Pacific Ocean, is usually correlated with weaker wind shear over the breeding grounds of the tropical Atlantic Ocean. This typically leads to a more favorable environment in the tropical Atlantic for the development/intensification of tropical activity. Indeed, with La Nina in full force last summer, the Atlantic Basin tropical season was the third-most active on record in terms of the number of named storms with 21.
While La Nina conditions were a favorable factor for tropical activity in the Atlantic Basin in 2021, it tended to suppress activity in the equatorial part of the Pacific Ocean. In both regions of the Pacific Ocean (i.e., to the east and to the west of the “international date line”), overall tropical activity was below-normal in 2021 in terms of accumulated cyclone energy (ACE). The ACE metric - which was originally created by Dr. William Gray and associates at Colorado State University and later tweaked by NOAA - not only factors in the intensity of a tropical cyclone, it also takes into account its longevity. A “major” hurricane, for example, that lasts for a long time will have a much bigger impact on the accumulated cyclone energy than a short-lived and weaker tropical system. The number of “major” hurricanes in the Pacific Ocean during the 2021 tropical season was well below the normal amount.

In general, an El Nino episode in the tropical Pacific Ocean tends to cause a spike in global temperatures and there is often a noticeable drop off during and after La Nina events as has occurred during the past several months. The latest monthly reading for January 2022 of UAH global temperature anomalies is +0.03 degrees (C) using the base period of 1991-2020 for comparison. Data source: Dr. Roy Spencer, University of Alabama at Huntsville (UAH)
La Nina’s impact on global temperatures
In addition to an impact on tropical activity, La Nina can indeed have ramifications on global temperatures that are largely driven by oceanic and solar cycles. In recent decades, the number of El Nino episodes has surpassed the number of La Nina events and global temperatures have often reacted with noticeable spikes. For example, temperatures spiked in 2016/2017 following a strong El Nino event and they had a secondary peak in 2019 associated with a second El Nino episode in the tropical Pacific. Prior to that, strong El Nino events that centered on the years of 1997/1998 and 2009/2010 were associated with sharp upticks in lower atmosphere global temperatures.
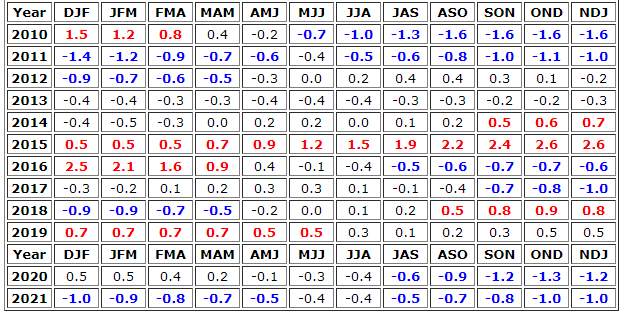
Warm (red) and cold (blue) periods are listed in this table back to 2010 and are based on a threshold of +/- 0.5°C for the Oceanic Niño Index (ONI) [3 month running mean of ERSST.v5 SST anomalies in the Niño 3.4 region (5°N-5°S, 120°-170°W)], based on centered 30-year base periods updated every 5 years. La Nina conditions developed late in the spring of 2020 and has continued into the winter season of 2021-2022 although it weakened at times. Data source: NOAA/CPC
In times of La Nina such as during 2007/2008 and 2010/2011/2012, there have been noticeable downturns in global temperatures of the lower atmosphere. Since the most recent El Nino incident of 2018/2019, La Nina has been in control and global temperatures have responded accordingly. In fact, there has been quite a noticeable drop in global temperatures over the past several months to the point that levels are nearly normal on a worldwide basis as of the latest reading of UAH data in January of 2022. If La Nina does indeed continue for several more months as depicted by some computer models, global temperatures could respond by holding at these nearly normal quantities or perhaps even by falling to below-normal levels.
Meteorologist Paul Dorian
Arcfield
arcfieldweather.com
Follow us on Facebook, Twitter, YouTube
Video discussion: