
*2024 Tropical Season and Summertime Outlook by Arcfield Weather*
Paul Dorian

Current sea surface temperature (SST) anomalies with La Nina (colder-than-normal, blue) conditions starting to show up in the tropical Pacific Ocean. Warmer-than-normal water (orange) exists across much of the breeding grounds region of the tropical Atlantic and throughout the Caribbean Sea. Map courtesy NOAA, tropicaltidbits.com
Overview
Numerous signs point to an active tropical season this year in the Atlantic Basin with more tropical storms, hurricanes, and “major” hurricanes compared to the long-term averages. The average number of named tropical storms in an Atlantic Basin tropical season is 14.4 with 7.2 of those reaching (minimal) hurricane status, and 3.2 becoming “major” (1991-2020 baseline period).
Based on my overall analysis of current and forecasted atmospheric and oceanic conditions, I expect around 16 named storms this season with around 9 reaching hurricane status and of those perhaps as many as 4 to achieve “major” classification level. Another metric to use in the assessment of overall tropical activity is known as the accumulated cyclone energy or ACE which utilizes both strength and longevity of tropical storms in its calculation and I expect this to be 150-160% of normal in the Atlantic Basin this tropical season.
The two most important parameters that have been factored into the “2024 Tropical Outlook” include: (1) the development of La Nina in the equatorial part of the Pacific Ocean and (2) warmer-than-normal sea surface temperatures in much of the breeding grounds region of the tropical Atlantic Ocean and Caribbean Sea…both of which are favorable for the development and intensification of tropical activity. I believe the most vulnerable areas to be directly impacted this upcoming tropical season include those in and around the Caribbean Sea, Gulf of Mexico, and Southeast US.

A list of names to be used for tropical storms/hurricanes in the 2024 Atlantic Basin tropical season. (Note – the Atlantic Basin includes the Caribbean Sea, Gulf of Mexico, and the North Atlantic Ocean). List of names courtesy weather.com
Executive Summary
An above-normal tropical season in the Atlantic Basin (16 storms, 9 hurricanes, 4 majors) with ACE around 150-160% of normal
Warmer-than-normal water in much of the breeding grounds region of the tropical Atlantic and across the Caribbean Sea (favorable)
The development of La Nina conditions in the equatorial Pacific Ocean (favorable)
There will be occasional intrusions of Sahara Desert (dry) air (unfavorable)
The most directly impacted areas this year may include the Caribbean Sea, Gulf of Mexico, and Southeast US
An analysis of five “analog” years (2010, 1970, 2011, 1975, 1999) in which there were similar sea surface temperature patterns featuring La Nina in the tropical Pacific Ocean suggest the following for the upcoming summer season:
quite warm in the eastern US, quite cool in the western US
wetter-than-normal in the Mid-Atlantic/Northeast US
drier-than-normal across Texas, Florida, and the Tennessee Valley

2023 Atlantic Basin summary map of storm tracks with the vast majority staying out over the open waters of the Atlantic Ocean (plot courtesy Wikipedia)
Recap of 2023
While the 2023 hurricane season in the Atlantic Basin was well above-normal in terms of the number of named storms, the news was not all bad with respect to the overall tropical season. Other important metrics were actually quite close to climatological averages, and the best news of all was that the vast majority of the named storms spent most, if not all, of their time harmlessly out over the open waters of the Atlantic Ocean. In fact, despite the active season in 2023, the only US landfalling hurricane was Hurricane Idalia which made landfall as a category-3 hurricane on August 30th near Keaton Beach, Florida. In addition, Tropical Storm Ophelia made landfall as a strong tropical storm with 70 mph winds on Emerald Isle, North Carolina on September 23rd. Hurricane Lee made landfall as a post-tropical cyclone in Nova Scotia, Canada, on September 16th and swells generated by Lee caused dangerous surf and rip currents along the entire U.S. Atlantic coast.
In terms of specifics, there were 20 named storms in 2023 having reached at least “tropical storm” status according to NOAA’s National Hurricane Center. This year’s total is well above the normal of 14.3 when using the base period of 1991-2020 for comparison. In fact, the total of 20 named storms in 2023 ranks fourth for the most-named storms since 1950. However, despite the higher-than-normal number of named storms, the number that reached hurricane status (7) and the number of major hurricanes (3) fell very close to the long-term climatological averages of 7.2 and 3.2 respectively. Aided by the high number of named storms, the metric known as the accumulated cyclone energy or ACE was measured at 145.6 versus the climatological average of 122.5.
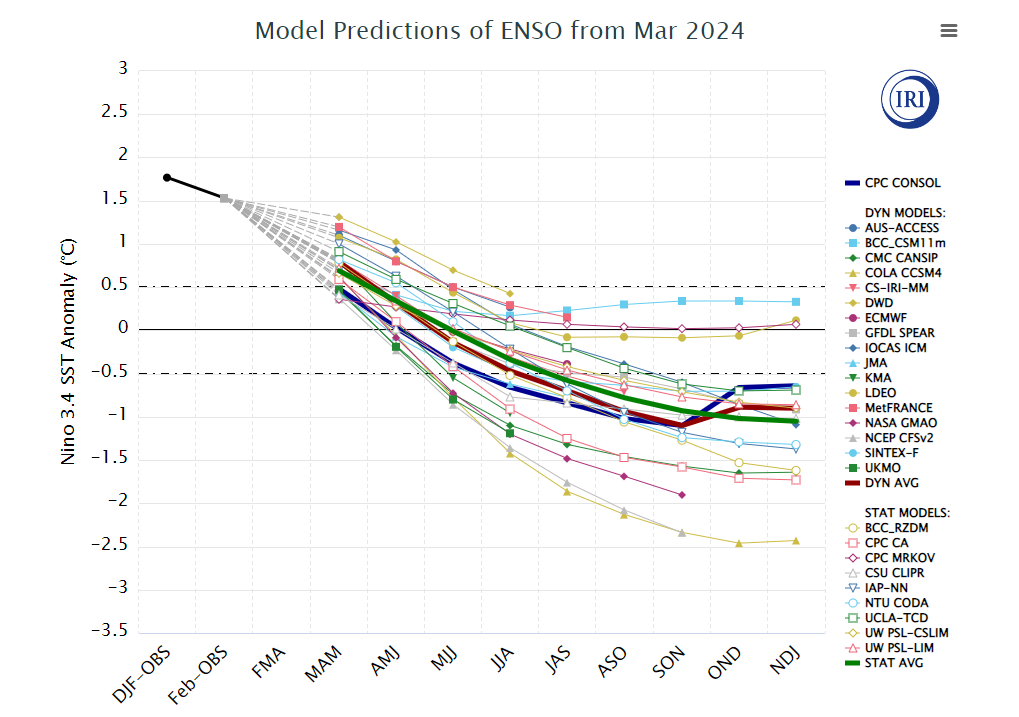
Compilation of computer model forecasts for El Nino Southern Oscillation (ENSO) state for the rest of 2024 with most depicting La Nina conditions in the equatorial Pacific Ocean for the bulk of the tropical season. The graph shows individual forecasts made by dynamical and statistical models for sea surface temperature (SST) anomalies in the Nino “3.4” region (central Pacific) for overlapping 3-month periods. Plot courtesy International Research Institute/CPC, NOAA, ECMWF, JMA
La Nina conditions in the tropical Pacific Ocean
What goes on in the tropical Pacific Ocean does indeed have an impact on tropical activity in the Atlantic Ocean. El Nino, which refers to warmer-than-normal waters in the equatorial Pacific Ocean, affects global weather patterns and it tends to be an inhibiting factor for tropical storm formation/intensification in the Atlantic Basin. First, El Nino tends to produce faster-than-usual high-altitude winds over the tropical Atlantic Ocean and this increase in wind shear (change of wind speed with height) is hostile to the development or maintenance of tropical storms. In addition, El Nino tends to result in sinking motion over parts of the Atlantic Basin which also is hostile to tropical storm formation/intensification.
On the other hand, La Nina conditions in the equatorial part of the Pacific Ocean usually correlates with weaker wind shear over the breeding grounds of the tropical Atlantic Ocean and this leads to a more favorable environment for the development/intensification of tropical activity. El Nino collapsed during the spring season and La Nina is now intensifying across the tropical Pacific and it looks like it will dominate this summer and last right through the fall. Numerous computer models forecast an intensification of La Nina into one with moderate-to-strong strength by the late summer.
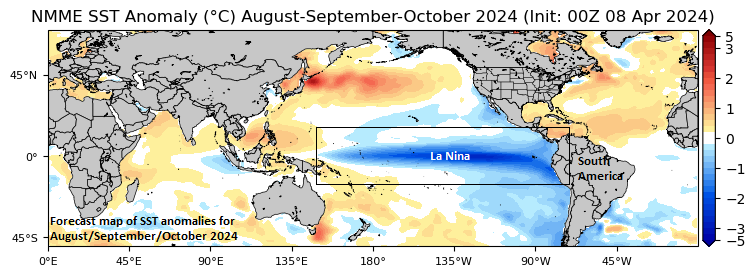
The North American Multi-Model Ensemble (NMME) forecast map of sea surface temperature anomalies is shown for the August/September/October 2024 period. The North American Multi-Model Ensemble is a multi-model, seasonal forecasting system consisting of coupled models from North American modeling centers including NOAA/NCEP, NOAA/GFDL, IRI, NCAR, NASA, and Canada's CMC. Map courtesy NOAA, tropicaltidbits.com
Warmer-than-normal water across much of the Atlantic Basin
Not only are Pacific Ocean sea surface temperatures important in terms of their potential impact on tropical activity in the Atlantic Basin, but Atlantic Ocean water temperatures are critical and play more of a direct role in the prospects for formation/intensification of tropical storms. Sea surface temperatures of >80°F are generally considered to be a necessary requirement for the formation of tropical storms in the Atlantic Basin. As a result, above-normal sea surface temperatures are more favorable for the formation and intensification of tropical storms as waves generally trek westward from Africa over the tropical Atlantic Ocean. On the other hand, colder-than-normal sea surface temperatures in the Atlantic Ocean will tend to suppress tropical activity.

A climatology of “La Nina” Atlantic hurricane seasons suggests the Caribbean Sea and Gulf of Mexico regions may be the most directly impacted by tropical activity this summer. Map courtesy NOAA, Eric Webb (Twitter)
Indeed, the water has been quite warm across much of the Atlantic Ocean and there is no reason to expect a change during the summer and fall (tropical) seasons. The warmer-than-normal water not only is expected in the main development grounds region of the tropical Atlantic, but also across the Caribbean Sea and Gulf of Mexico. A look at the climatology of tropical storm tracks during “La Nina” Atlantic hurricane seasons suggests that the most vulnerable regions for impact this summer and fall will include the Caribbean Sea and Gulf of Mexico. This threat may be at its highest during the second half of the tropical season when “home-grown” systems tend to dominate in the Atlantic Basin. (What I refer to as “home-grown” systems are those that form over the Caribbean Sea, Gulf of Mexico or the western Atlantic Ocean as compared with those that take the long westward trek from western Africa towards the US).


The 5 analog years that I have selected are based on comparisons with sea surface temperature patterns which featured La Nina conditions in the tropical Pacific. In terms of US temperatures, these years featured cooler-than-normal conditions on average across the western half of the nation, and generally, above-normal in the eastern half (top plot). In terms of precipitation, the eastern third of the nation featured wetter-than-normal conditions while Texas, Florida, and much of the Tennessee Valley region were drier-than-normal (bottom plot).
A look at analog years and their signals for the upcoming summer across the US
Based largely upon the expectation of a continuation of La Nina this summer and fall, there are five analog years that I have selected which featured similar sea surface temperature anomalies and trends. When averaged together, these five analog years featured slightly above-normal tropical activity in the Atlantic Basin. The seven analog years listed here include the number of named storms, number of minimal hurricanes, and the number of “major” hurricanes in each given year: 1975 (9/6/3), 1970 (14/7/2), 2011 (19/7/4), 2010 (19/12/5), and 1999 (12/8/5).
In the Mid-Atlantic region and much of the eastern US, these five analog years generally featured warmer-than-normal temperatures in the June through September time frame. In terms of specific temperature anomalies in the Mid-Atlantic and Northeast US, I expect the summer season to average somewhere in the +1.0 to +3.0 range. In terms of precipitation, much of the Mid-Atlantic and Northeast US may be in store for wetter-than-normal weather this summer which follows a wetter-than-normal winter and spring in most areas. Elsewhere, the summer weather highlights may include cooler-than-normal weather across much of the western US, drier-than-normal conditions across Texas, Florida, and the Tennessee Valley.
Meteorologist Paul Dorian
Arcfield
arcfieldweather.com
Follow us on Facebook, Twitter, YouTube
Video discussion: