
*Second year in a row with below-normal tropical activity across the Northern Hemisphere… western Pacific leads the way with 7th straight down year...no hurricanes hit US for first time in a decade*
Paul Dorian
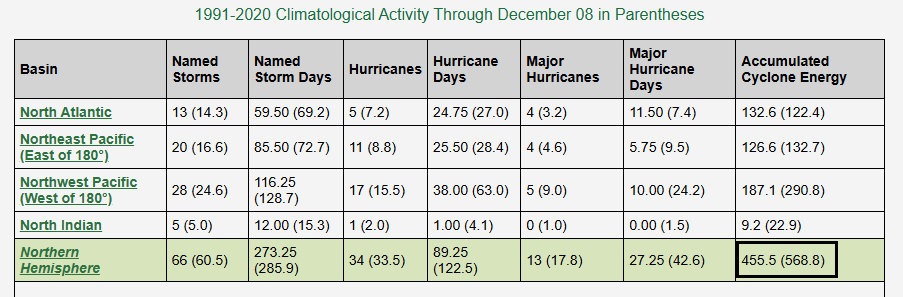
Accumulated Cyclone Energy values (right column) are listed for the Northern Hemisphere as a whole and are also broken down into sectors including the North Atlantic, Northeast Pacific, Northwest Pacific, and North Indian. Real-time ACE statistics are calculated from the best operational tracks of NHC, CPHC and JTWC. Table courtesy Colorado State University
Overview
The 2025 hurricane season is winding down across the Northern Hemisphere, and it has been the second straight season with below-normal activity as measured by the metric known as the “Accumulated Cyclone Energy (ACE)”. The most important region when it comes to tropical activity in the Northern Hemisphere is the western half of the Pacific Ocean as it features the highest ACE value of any sector from a climatological point-of view and it was well below-normal for the 2025 tropical season. In the Atlantic Basin, tropical activity ended up slightly above the normal in terms of ACE thanks in large part to the end-of-season blockbuster hurricane named “Melissa” which reached category 5 status and lasted for a lengthy period. However, there were no landfalling hurricanes in the US for the first time since 2015, and the number of hurricanes (5) was below the long-term average of 7.2.

Last 50-years+ of Global and Northern Hemisphere Accumulated Cyclone Energy: 24 month running sums (through July 2025). Note that the year indicated represents the value of ACE through the previous 24-months for the Northern Hemisphere (bottom line/gray boxes) and the entire global (top line/blue boxes). The area in between represents the Southern Hemisphere total ACE. Plot courtesy NOAA, Dr. Ryan Maue
Accumulated Cyclone Energy (ACE)
The Accumulated Cyclone Energy or ACE metric was originally created by Dr. William Gray and associates at Colorado State University, and it was later tweaked by NOAA. This is perhaps the best metric to measure overall tropical activity (as opposed to, for example, the number of storms) – as it not only factors in the intensity of a tropical cyclone, but it considers its longevity. A “major” (category 3 or higher) hurricane, for example, that lasts for a long time will have a much bigger impact on the Accumulated Cyclone Energy than a short-lived and weaker tropical system.
Pacific Ocean
The Pacific Ocean is so large it is generally split into two sectors by meteorologists in the tracking of tropical activity using the international date line as the divider. The western part of the Pacific Ocean is the most important when it comes to global tropical activity as suggested by the climatological ACE which outweighs all other sectors of the northern hemisphere. The ACE levels for 2025 were slightly below-normal east of the date line and well below-normal in the all-important western Pacific. In fact, this crucial part of the Pacific Ocean has experienced below-normal activity during each of the past 7 years with seasonal ACE levels in each of those years below the average for the 1991-2020 baseline period. Interestingly, the number of storms in the western Pacific Ocean this season was above normal, suggesting the ACE level per storm was below the averages (i.e., more storms than normal, but they were weaker and of shorter duration compared to normal).
Annual Atlantic Multidecadal Oscillation (AMO) detrended index values since 1856. The thin line indicates 3-month average values, and the thick line is the simple running 11-year average. Further explanation in text above. Data source: Earth System Research Laboratory at NOAA. Last year shown: 2022. Last diagram update: 24 January 2023.
Atlantic Basin
While the Pacific Ocean featured below-normal tropical activity this season when measured by ACE levels, the Atlantic Basin ended up slightly above the normal. A large part of this finish at slightly above normal ACE levels in the Atlantic Basin was due to the very last storm, Hurricane Melissa, which reached category 5 status and was rather long-lived. The tropical wave that became Melissa originated over West Africa and traveled across the central Atlantic to the Caribbean Sea where is strengthened into a named tropical storm on October 21st. In just a few days after that, Melissa rapidly intensified into a Category 5 hurricane before making landfall in Jamaica while at its peak intensity...the strongest Atlantic landfalling hurricane since Dorian in 2019 (both winds maximum sustained winds of 185 mph). Hurricane Melissa then crossed over eastern Cuba and the central Bahama Islands and approached Bermuda as a Category 2 hurricane by the end of the month.
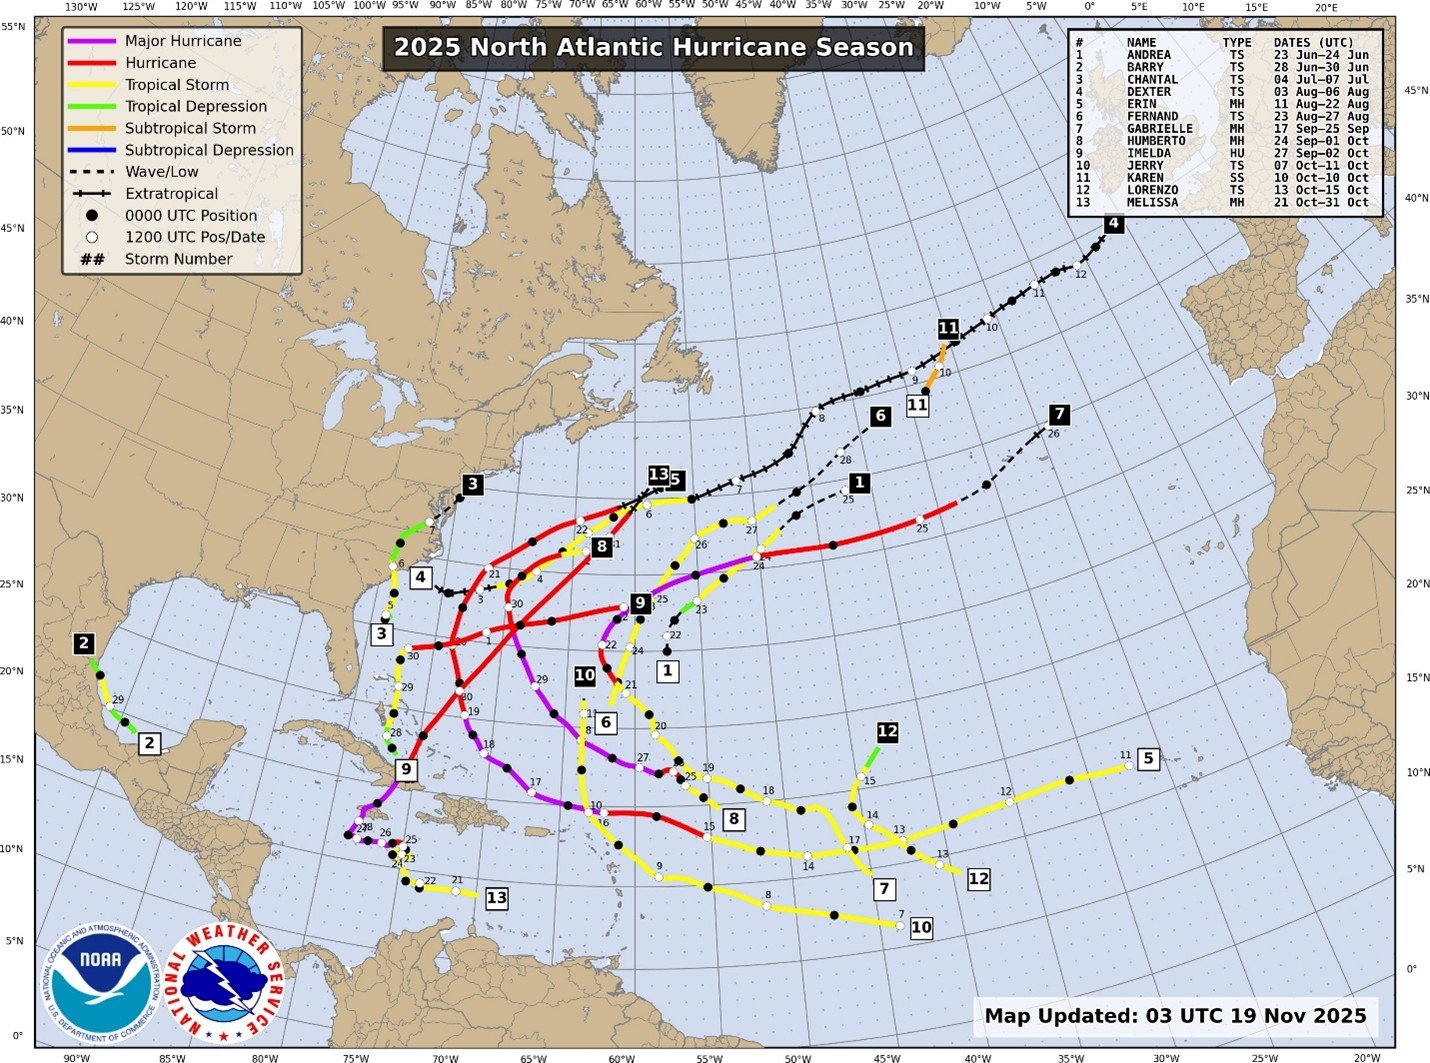
There were no landfalling hurricanes this year in the US for the first time since 2015. Credit NOAA
In contrast to the western Pacific where ACE levels have been below-normal for the past 7 years, the Atlantic Basin has experienced above-normal conditions in 9 of the last 10 seasons (only below-normal year was 2022). Also, in contrast to the western Pacific where the number of storms was higher than normal but ACE per storm was lower than normal, the number of storms (13) in the Atlantic Basin this year was below-normal suggesting that the average ACE per storm there was above-normal. Interestingly, there were no landfalling hurricanes in the US this year which is the first time that has happened in ten years.

Water temperatures were above-normal in the Atlantic Ocean’s Main Development Region (MDR) during the heart of the tropical season (shown August-November). Water temperatures in the North Atlantic have been persistently above normal since the Atlantic Multidecadal Oscillation (AMO) flipped in the middle 1990’s to a warm phase from a cold phase. Plot courtesy NOAA, tropicaltidbits.com (Levi Cowan)
One of the factors leading to consistent levels of above-normal activity in the Atlantic Basin during recent years is the persistent warmer-than-normal sea surface temperature pattern across the main development region. One index that gives us a clue as to the water temperatures in the Atlantic Ocean is known as the Atlantic Multidecadal Oscillation (AMO). The AMO represents a long-term cycle of sea-surface temperature variations in the North Atlantic that influences weather patterns across North America and globally. It's linked to changes in the frequency and intensity of Atlantic hurricanes, drought conditions in North America and Africa, and large-scale atmospheric circulation patterns. During a warm phase, the AMO is associated with an increase in the intensity and frequency of Atlantic hurricane seasons. Since ~1995, the AMO has been in a warm phase and if past patterns hold, the warm phase will potentially continue for another 5 or 10 years.
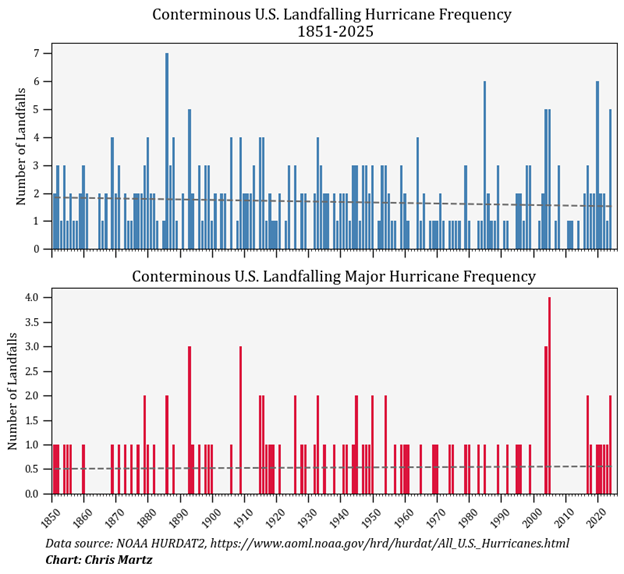
The trends are shown here for the US landfalling hurricanes (top) and US landfalling major hurricanes (bottom) since the middle 1800’s to the present time. Source NOAA, Meteorologist Chris Martz
One final note on the comparison of tropical activity in today’s era to periods in the past, there are likely to be significant underestimations in intensities of tropical systems prior to the satellite era (mid-1960’s) according to some hurricane experts (e.g., Dr. Philip Klotzbach (CSU), Christopher Landsea (NOAA).
Meteorologist Paul Dorian
Arcfield
arcfieldweather.com
Follow us on Facebook, Twitter, YouTube