Contact Us

Use the form on the right to contact us.

You can edit the text in this area, and change where the contact form on the right submits to, by entering edit mode using the modes on the bottom right. 


123 Street Avenue, City Town, 99999

(123) 555-6789

email@address.com


You can set your address, phone number, email and site description in the settings tab.
Link to read me page with more information.

backlit-stratus-clouds-2013-04-05.jpg

Blog

Weather forecasting and analysis, space and historic events, climate information

Filtering by Category: Climate Info

9:00 AM | Another down year in the US for hurricanes and tornadoes

Vencore Weather

More good news this year for the nation on the extreme weather front as it has been another down year in terms of hurricanes and tornadoes. The Atlantic Basin hurricane season officially ends tomorrow, December 1st, and it is quite likely safe to say that this will be another below-normal year in the US for land falling tropical storm activity. In fact, the US has not been struck by a major hurricane (category 3, 4 or 5) in slightly more than ten years and this is the longest drought of that kind since record-keeping began in 1851. In addition, 2015 is turning out to be another below-normal year for tornadoes across the nation and this too continues a trend that is a decade in the making.

Read More

12:40 PM | *Soaking rain event on Thursday to be followed by cold blast for the weekend…coldest weather so far for Sunday and Monday...looking ahead to Turkey Day*

Paul Dorian

storm.png

[Today's satellite image of major storm that is headed into the eastern US; courtesy NASA, Capital Weather Gang]

Discussion

Thursday rain event

A powerful storm system that currently extends from Mexico to Canada is headed towards the eastern US and it will produce a significant rain event for much of the region on Thursday (satellite image above). This is the same storm system that produced heavy snow and winter cold in Colorado and Kansas earlier in the week as well as tornadoes in its warm sector across parts of the central US. The rain is likely to arrive here late tonight and continue through the morning and it could very well have a negative impact on the morning commute in DC, Philly and perhaps even New York City (could hold off there until just afterward rush hour). The winds will be quite gusty tomorrow ahead of a strong cold front and there can be an isolated thunderstorm or two during this upcoming event.

sun_am_fcst_map.png

[12Z GFS surface forecast map for Sunday morning (blues=snow); courtesy NOAA, tropicaltidbits.com]

Progressively colder Friday, Saturday and Sunday

This significant rain event will be followed by a colder air mass in the Mid-Atlantic region to close out the work week on Friday, but this will be just the first "step-down" in temperatures in coming days. Another storm system will move quickly from the Rockies this weekend and head towards the Great Lakes region likely producing the first accumulating snow of the season in places like Chicago, Detroit and Madison. This next storm will slide a secondary cold front through here on Saturday night and the coldest air mass of the season will arrive on Sunday. In fact, Sunday promises to be the coldest day of the season so far and snow flurries/snow showers are not out of the question across portions of the Mid-Atlantic and Northeast US (forecast surface map above; blue=snow). Well-below normal temperatures will remain stuck in place across the eastern US on Monday as we begin the new work week (temperature anomaly forecast map below).

mon_am_temps.png

[12Z GFS temperature anomaly forecast map for Monday morning; courtesy NOAA, tropicaltidbits.com]

Looking ahead to Turkey Day and beyond

While still chilly next Tuesday, it is likely that the second half of next week will see a turn to milder conditions in the eastern US following this weekend’s cold blast and before another cold blast arrives late in the weekend following Thanksgiving Day. This next cold blast which will arrive near the end of November is likely to be even colder than this weekend’s outbreak.

10:00 AM | Heavy rain event on Thursday triggers pattern change to noticeably colder

Paul Dorian

days1-5.png

[00Z GFS Ensemble 2-meter temperature anomaly forecast map for days 1-5; courtesy NOAA, "tropicaltidbits.com"]

Discussion

Near term

So far the month of November has been well above normal in the Mid-Atlantic region (Philly +7.1°, DCA +5.0°, NYC +6.4°), but it looks like the overall mild pattern is going to change noticeably to colder for the last ten days of the month and perhaps right even into early December and all of this is going to be triggered by a heavy rain event on Thursday. After a mild day to start the work week, there will be a temporary setback in the mild temperatures on Tuesday as a back door cold front slides southward through the Mid-Atlantic region during the overnight hours. High temperatures on Tuesday afternoon will be some ten degrees cooler than what is expected later this afternoon. Milder air pushes northward again on Wednesday and Thursday riding in on increasingly strong south-to-southwest winds and a strong cold front will be approaching from the west. Heavy rain is likely from the cold frontal system late Wednesday night and Thursday in the I-95 corridor and this event will trigger the temperature pattern change to colder beginning by this upcoming weekend.

days6-10.png

[00Z GFS Ensemble 2-meter temperature anomaly forecast map for days 6-10; courtesy NOAA, "tropicaltidbits.com"]

Longer term

Last night’s GFS Ensemble run at 00Z shows nicely the changes that are coming not only here to the Mid-Atlantic region for the last ten days of the month, but also to much of the nation as well. The first map (top) shows the overall temperature anomalies across the US for days 1-5 (16NOV-21NOV). Warmer-than-normal conditions (oranges) dominate in the eastern US with mainly colder-than-normal (blues) weather out west during this current 5-day stretch. Beyond that, the 6-10 day (21NOV-26NOV) temperature anomaly forecast map (middle) shows big changes in the Mid-Atlantic region with colder-than-normal (blues) conditions and it is similarly cold throughout most of the nation away from the southwestern states. Does the cold hold beyond that time period? The 11-15 day (26NOV-01Dec) temperature anomaly forecast map (bottom) indicates it certainly will with colder-than-normal weather continuing in most of the nation right from Thanksgiving into the beginning of December. As far as snow is concerned, there are signs for some threats in the Northeast US in the weekend after Thanksgiving or the early part of December and we’ll monitor those chances in the days ahead.

days11-15.png

[00Z GFS Ensemble 2-meter temperature anomaly forecast map for days 11-15; courtesy NOAA, "tropicaltidbits.com"]

11:40 AM | El Nino should completely reverse in a year or so

Paul Dorian

cdas-sflux_ssta_global_1.png

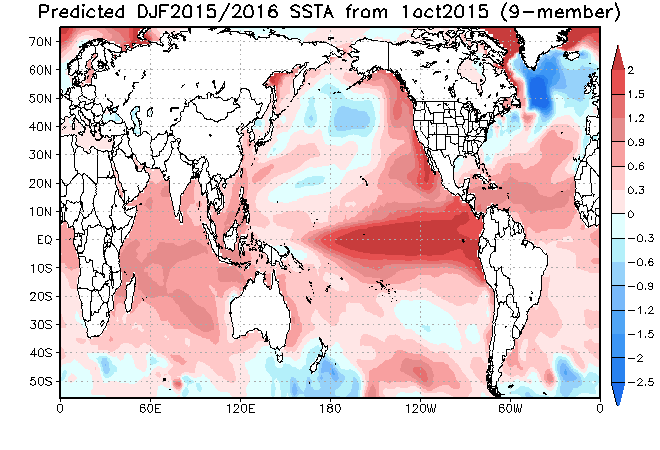
[Current SST anomalies with El Nino region circled; data courtesy NOAA, map courtesy "tropicaltidbits.com"]

Overview

El Nino conditions developed last year in the equatorial part of the Pacific Ocean and they have intensified significantly in the past several months. In fact, it appears that this El Nino will end up rivaling in strength the comparable events of 1972-1973, 1982-1983 and 1997-1998. This type of natural phenomenon features warmer-than-normal sea surface temperatures in the tropical Pacific Ocean while its counterpart called La Nina is associated with colder-than-normal waters. Given the fact that the Pacific Ocean is by far the world’s largest, it is not surprising that an El Nino of this magnitude is having major ramifications around the world and it will continue to do so for the next several months. Indeed, this El Nino is quite likely to play an important role in the upcoming winter around here in the Mid-Atlantic region: http://vencoreweather.com/2015/10/14/400-pm-2015-2016-winter-outlook-for-the-mid-atlantic-region/. There are some indications that the peak of this current El Nino episode will occur over the next month or two and then it’ll begin to weaken during the early part of 2016. In fact, there are some computer model forecasts that suggest this strong El Nino will completely reverse in a year or so to strong La Nina conditions and this too would have significant consequences around the world.

SST Anomalies

In the past few months, warmer-than-normal sea surface temperature anomalies (circled orange area in above plot) have spread westward from the west coast of South America into the central equatorial Pacific Ocean. Computer forecast models are in general agreement that this strengthening trend in the El Nino will reach its peak over the next couple of months and then there will be weakening next year. The effects of the current strong El Nino have already been appearing in numerous ways around the world. To begin, the added warmth to the sea surface temperatures in the Pacific Ocean has helped to fuel a very active tropical season in that part of the world. In addition, the Atlantic Basin has actually experienced a below-normal tropical season which is often the result of an El Nino as it tends to increase wind shear across the tropical Atlantic Ocean which, in turn, inhibits tropical storm formation.

Global temperatures

In addition to its impact on tropical storm activity, El Nino tends to generate a spike in global temperatures. The plot below of global temperature anomalies is produced by NOAA’s CFSv2 model and the circled areas show the spikes in global temperatures associated with recent El Nino events of 2006-2007 and 2009-2010 as well as the jump caused by the current episode. The spike associated with the current El Nino may continue for the next several months as there is often a lag in the effects of El Nino well past the actual peak in sea surface temperature anomalies. In other words, even if El Nino begins to weaken during early 2016, a residual “warming” effect can still show up for awhile with respect to global temperature anomalies. One other important point to make regarding the global temperature anomaly pattern that is related to El Nino is that in each of the recent El Nino events of 2006-2007 and 2009-2010, global temperatures dropped sharply in subsequent months following the El Nino.

global_temps_2005_to_OCT09_2015.png

[NOAA CFSv2 global temperature anomalies; courtesy Ryan Maue of Weather Bell Analytics]

Strong La Nina may be just a year away

Some computer forecast models are already predicting the demise of the current El Nino and, in fact, suggest a strong La Nina (colder-than-normal SSTs) will replace it by the end of next year. The plot below is a computer model forecast map from the Scripps Institution of Oceanography and it predicts there will be a strong La Nina event in a year or so in the same tropical region of the Pacific Ocean that is now experiencing well above-normal SSTs. As has been the case with the recent two El Nino events, a reversal like this would quite likely have serious ramifications on global temperatures. It would not be surprising to see another sharp drop in global temperatures once the current strong El Nino event fades away and La Nina conditions return to the tropical Pacific Ocean.

la-nina-forecast.png

[Scripps Institution of Oceanography forecast map of tropical Pacific Ocean SST anomalies during late 2016 (greens, blues are colder-than-normal water temperatures]

Paul Dorian

Vencore, Inc.

Valley Forge, PA

9:30 AM | Substantial increase in Siberian snowpack...bodes well for some cold, snow around here

Paul Dorian

Picture11.png

[Increase in October snowpack across Siberia (white=snowcover, yellow=ice); courtesy US National Ice Center/NOAA]

Discussion

One of the key reasons provided in the mid-month release of Vencore Weather’s “Winter Outlook” (http://vencoreweather.com/2015/10/14/400-pm-2015-2016-winter-outlook-for-the-mid-atlantic-region/) for the expectation of a snowy winter in DC, Philly and NYC had to do with the fact that there were numerous favorable signs for “high-latitude blocking” this upcoming winter. “High latitude blocking” is an atmospheric phenomenon that can be tracked by meteorologists through an index called the Arctic Oscillation (AO) and it often leads to cold air outbreaks in the Northeast US (usually with a negative index value). Studies have shown that an increase in snowpack across Siberia during the month of October – specifically in areas south of 60°N – is pretty well correlated with persistent negative AO index values in subsequent winter months and “high latitude blocking” events (http://web.mit.edu/~jlcohen/www/papers/Gong_JC03.pdf). This in turn is often correlated with cold air outbreaks in the Northeast US which, of course, is a necessary requirement around here for snow. Indeed, the snowpack across Siberia has increased dramatically from the beginning of October to now – even in those areas south of 60°N. In fact, there are reports that in just the last three days the Siberian snowpack has increased by over 2 million square kilometers (source WxRisk.com).

10_28_NH.png

[Current Northern Hemisphere snowpack (brown=snowcover); courtesy Rutgers Snow Lab]

The top figure compares the snow cover (white region) across Siberia from the end of September to today’s level. There has been a steady increase in snowpack in Siberia over the past few weeks from the mainly snow-free grounds at the beginning of the month. In addition to northern Canada and Greenland, Siberia can be a crucial cold air source for the northeastern states during any given winter season. It is not uncommon for an air mass to build up over a several day period in the wintertime over a snow-packed Siberia and then have it make a move across the North Pole into northern Canada and then eventually into the northern US. The second figure above displays a current view of the snow pack across the Northern Hemisphere and - in addition to Siberia - northern Canada and Greenland are now well covered by snow (brown region; data courtesy Rutgers Snow Lab). (One final note, there is an unofficial report of the lowest October temperature ever recorded in Greenland on 10/24 at -67.72°F).

12:45 PM | Study shows hurricanes in global downward trend during last 25 years

Paul Dorian

ACE.png

Overview

Whether these findings are part of normal "year-to-year" variability or indeed part of a long-term trend, the results of a new study are quite interesting. Philip Klotzbach (Department of Atmospheric Science, Colorado State University) and Christopher Landsea (NOAA/NWS/National Hurricane Center) have just published the results of a study in which they conclude shows “large, significant downward trends” in Accumulated Cyclone Energy in the Northern Hemisphere, the Southern Hemisphere and globally during the 25-year period of 1990-2014. In addition, the study has found “small, insignificant” trends in intense (category 4-5) hurricane frequency and percentage in the same 25-year period on a global basis. The results of this study have been published in the October edition of the Journal of Climate: http://journals.ametsoc.org/doi/abs/10.1175/JCLI-D-15-0188.1).

Accumulated Cyclone Energy (ACE)

Accumulated Cyclone Energy (ACE) is a commonly-used metric for tropical activity because it is not dependent on exact numbers of named storms or hurricanes, but rather is based on both the intensity and longevity of all tropical storms and hurricanes (so a long-lived tropical storm could contribute as much ACE as a short-lived storm that reached hurricane intensity). The figure below from the Klotzbach and Landsea journal article displays the ACE levels for the 45-year period from 1970 through 2014. The top half of the figure displays ACE by year for each of the six global tropical cyclone basins since 1970. These values are combined into hemispheric and global sums in the bottom half of the figure. There has generally been a decreasing trend in ACE since the early 1990s when a prolonged El Nino event enhanced activity in the North Pacific.

paper-ACE.png

[Accumulated Cyclone Energy (ACE) 1970-2014; courtesy Klotzbach and Landsea (1 October 2015, Journal of Climate)]

This year’s tropical activity

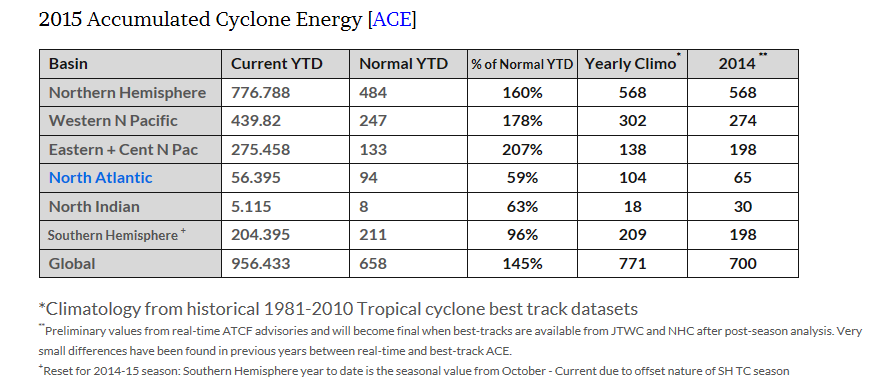
In terms of ACE for 2015, it has been very active in the Pacific Ocean aided in large part by a strong El Nino event (warmer-than-normal water) in the tropics. Indeed, the ACE values are well above normal in both the western North Pacific and the eastern/central North Pacific (table below; data courtesy Ryan Maue of Weather Bell Analytics; http://models.weatherbell.com/tropical.php). On the other hand, the Atlantic Ocean has actually been below normal with respect to ACE and that is partly due to the same El Nino event that has helped to fuel Pacific Ocean tropical storms. Evidence shows that in El Nino years, there is an added level of wind shear in the tropical Atlantic Ocean which tends to inhibit tropical storm formation. The downturn in Atlantic Basin tropical activity during 2015 has helped keep alive a 10-year drought in the US with respect to major hurricane (categories 3, 4 and 5) strikes. In fact, we have just passed the 10-year anniversary for the last major hurricane landfall in the US (Wilma in Florida, October 2005) which is the longest drought ever logged in the record-keeping era.

ACE.png

[2015 Accumulated Cyclone Energy (ACE) on a global basis; data courtesy Ryan Maue, Weather Bell Analytics]

Looking ahead to the tropics

There is a word of caution for the US, however, as this year’s strong El Nino event in the tropical Pacific Ocean is quite likely to weaken during 2016 and the “beneficial” effect of higher-than-normal wind shear in the Atlantic Basin is likely to diminish by next summer potentially leading to an uptick in activity. In fact, this potential increase in Atlantic tropical activity next year could even extend into 2017 as La Nina conditions (colder-than-normal waters) are quite possible by that time in the tropical Pacific Ocean. Meanwhile, it is entirely possible that at the same time the Atlantic Ocean tropical activity potentially increases during the next couple of years, the Pacific Ocean could experience somewhat quieter conditions compared to today as sea surface temperatures drop relative-to-normal with the gradual demise of El Nino.

11:15 AM | *Category 5 Hurricane Patricia to slam Mexico later today*

Paul Dorian

vis.png

[Visible satellite image of Hurricane Patricia shortly after sunrise; courtesy NASA]

Discussion

Hurricane Patricia intensified explosively yesterday from a category 1 storm early in the day to a category 5 level by early today - perhaps reaching the strongest levels ever seen during the record-keeping era in the eastern Pacific Ocean in terms of central pressure (880 mb or 25.98 inches) and wind speeds (maximum sustained winds near 200 mph). It is likely to make landfall later today somewhere between Puerto Vallarta and Manzanillo with 185 mph wind gusts possible along with torrential rainfall.

Fueled by one of the strongest El Nino events since 1950, Patricia has become the 9th hurricane in the eastern Pacific to achieve at least category 4 or 5 intensity, which is the most during the record-keeping era. The storm has been able to achieve incredible intensification by developing over some of the warmest ocean temperatures in the Northern Hemisphere, over 86 degrees. In fact, the “boxed-in” region on the sea surface temperature plot (below) has water temperatures that average 1°C higher than at any time in the last 34 years (source: Ryan Maue of WeatherBell Analytics).

SST.png

[Sea surface temperature analysis of eastern Pacific Ocean region (dark brown region is 86-87 degrees F); source Weather Bell Analytics]

According to the National Hurricane Center, early this morning Patricia became the strongest hurricane recorded for the eastern Pacific and Atlantic Ocean. The estimated central pressure of Patricia dropped to 880 mb, breaking the record of 894 mb from Hurricane Linda in the eastern Pacific set in 1997 and also surpassing the 882 mb pressure of Hurricane Wilma in the Atlantic from 2005. The maximum sustained winds of 200 mph (160 knots) breaks the previous wind speed record from Linda and Wilma (185 mph) for the strongest surface winds ever in the area of responsibility of the National Hurricane Center.

Slide12.jpg

[Colorized IR image of Hurricane Patricia from early today; courtesy NOAA, NASA]

While significant weakening will occur after the center of Patricia heads inland, copious amounts of moisture will head northeastward across Mexico bringing flooding along its path this weekend. By late in the weekend, the remains of Hurricane Patricia will head into the Texas/Louisiana section of the Gulf coastal region in the US bringing heavy rains and strong winds. The moisture is then likely to get caught up in a frontal system early next week across the Mississippi and Ohio Valleys and it could generate widespread heavy rainfall and even a significant severe weather outbreak. By the middle of next week, this system and its moisture field will likely arrive in the Mid-Atlantic region.

Video

httpv://youtu.be/Teq0obGyDJs


Paul Dorian

Vencore, Inc.

4:00 PM | 2015-2016 Winter Outlook for the Mid-Atlantic Region

Paul Dorian

Overview

It looks like the Mid-Atlantic region is going to experience another snowy winter with numerous coastal storms – and there can even be a blockbuster snowstorm or two. Temperatures are likely to average out to near normal or slightly above-normal for the winter season in the Mid-Atlantic region, but there will be occasional Arctic air outbreaks as well. Warmer-than-normal weather is likely across much of the northern US and colder-than-normal conditions are expected in much of the Deep South. Last winter, the Mid-Atlantic region suffered through a snowy and cold winter and farther up the coastline, Boston, Massachusetts experienced its snowiest winter ever. If this winter does indeed produce more snow than normal in DC, Philly, and New York then it would be the third in a row which is quite uncommon around here.

Key factors

There are several key factors listed below that were involved with this year’s winter outlook:

1. Strong El Nino conditions focused in the central part of the tropical Pacific Ocean

2. A warm sea surface temperature anomaly in the northeastern Pacific Ocean

3. Warmer-than-normal sea surface temperatures near the US east coast

4. Favorable signals for “high-latitude blocking” from a) Arctic Oscillation index trend during the summer and fall, b) autumnal snowpack in the northern hemisphere, and c) low solar activity

5. Analog years: 1997-1998, 1991-1992, 1982-1983, 1957-1958, 2009-2010, 1986-1987

El Nino

A very strong El Nino event is well underway in the tropical Pacific Ocean and it will play a vital role in our upcoming winter weather. Very strong El Nino events were taking place on average about once a decade in the latter part of last century (1972-1973, 1982-1983, 1997-1998); however, the first decade of this century did not feature a comparable very strong El Nino. Instead, there were three moderate El Nino events to begin this century in the following years: 2002-2003, 2006-2007 and 2009-2010. The current El Nino is more analogous in strength to those episodes which occurred in the 1970’s, 1980’s and 1990’s.

The current El Nino began during the latter part of last year and strengthened considerably earlier this year. An El Nino of this magnitude is likely to increase the intensity of the southern branch of the jet stream during the winter season and it'll act to pump a lot of moisture into the upper-level wind flow. The southern branch of the jet stream is crucial for the development of storms in the southwestern US (e.g., California) that can then travel across the southern US and ride up the east coast (i.e., coastal storms). Strong El Nino’s have produced some blockbuster snowstorms for the Mid-Atlantic region in the past (e.g., February 1983) and the combination of the “pumped up” southern branch of the jet stream and warmer-than-normal sea surface temperatures near the US east coast raises the prospects for just such an event or two this winter.

While the magnitude of El Nino is very important as far as its potential impact on our winter weather, so is its location. A “centrally-based” El Nino is one in which the greatest sea surface temperature anomalies are located in the central tropical Pacific Ocean whereas an “eastern-based” El Nino has the warmest water relative–to-normal much closer to the west coast of South America. A “centrally-based” El Nino is more likely to be associated with an upper-level ridge of high pressure along the west coast of North America and this, in turn, can help to push cold air masses into the northeastern US. On the other hand, an “eastern-based” El Nino (e.g., 1997-1998) with its warming focused near the west coast of South America would more likely result in southwesterly winds across the eastern US producing warmer-than-normal wintertime conditions. I believe the most recent changes in the overall sea surface temperature pattern across the tropical Pacific Ocean favor the idea of a “centrally-based” El Nino this winter and multiple computer forecast models tend to support this notion (NOAA CFSv2, JAMSTEC, UKMET).

Northeastern Pacific Ocean warm pool of water

El Nino is not the only game in town as far as the winter outlook is concerned and it is important to look elsewhere. Another important region that may impact our winter weather is the northeastern Pacific Ocean where a warm pool of water has persisted for the past couple of winters. It appears that this pattern will continue through another winter season and this should help to generate high pressure ridging along the west coast of North America which, in turn, should push cold air outbreaks into the northeastern US.

Two independently-made sea surface temperature anomaly forecasts made for the upcoming winter season (below) tend to agree on the major players across the all-important Pacific Ocean. NOAA’s CFSv2 suggests the El Nino conditions will become more “centrally-based” in the Pacific Ocean during the winter season and that there will be a continuation of warmer-than-normal water in the northeastern Pacific Ocean. The JAMSTEC forecast model is produced by Japan’s Meteorological Agency and it tends to agree with the NOAA/CFSv2 forecast in the overall sea surface temperature pattern in the Pacific Ocean.

CFSv2-SST-fcst.gif

[NOAA/CFSv2 SST anomaly forecast for Dec/Jan/Feb; courtesy NOAA]

JAMSTEC1.gif

[JAMSTEC SST anomaly forecast for "Dec/Jan/Feb"; courtesy Japan Agency for Marine-Earth Science and Technology]

Analog years

While sea surface temperatures never repeat exactly from one year to another, it is still quite useful for long-range forecasting purposes to find “analog years” in which there are somewhat similar oceanic patterns to current conditions. Indeed, I believe the following winter seasons featured somewhat analogous sea surface temperature patterns compared to today’s environment and they can provide us a clue as to what type of winter we may experience around here: 1997-1998, 1991-1992, 1982-1983, 1957-1958, 2009-2010 and 1986-1987. The one overriding characteristic of these analog years is that they all featured moderate or strong El Nino events in the tropical Pacific Ocean. Note- even though there was a strong El Nino event in 1972-1973, it is not included in my analog year list as there were significant sea surface temperature differences in the northeastern Pacific Ocean compared to the today.

These particular analog winter seasons resulted in overall temperatures that averaged above-normal across the northern US and below-normal in southern areas of the US. The Mid-Atlantic region was sandwiched between these two zones with near normal or slightly above normal conditions on average during these analog years.

analog-years-temps.png

[Average Dec to Feb temperature anomaly pattern for the analog years; courtesy NOAA]

An interesting finding with respect to temperatures in these chosen analog years is revealed when looking at “month-to-month” anomalies. There was a clear tendency for the eastern US to become progressively colder relative-to-normal as the winter season evolved. Warmer-than-normal temperatures (seen in yellow, orange, red) were quite expansive in December across the eastern US during these analog years and then they retreated somewhat in January and then even more so during February.

Dec_Jan_Feb_temperatures_analog_years1.png

[Month-to-month breakdown of temperature anomalies during the analog years; courtesy NOAA]

As far as precipitation is concerned, these analog years featured on average wetter-than-normal conditions in the southern states as well as along much of both coastlines. As with temperatures, this is a somewhat typical pattern seen during winter seasons in El Nino years and is reflective of the “pumped up” southern branch of the jet stream.

analog-precip.png

[Average Dec to Feb precipitation anomaly pattern for the analog years; courtesy NOAA]

“High-latitude blocking”

If the current strong El Nino in the tropical Pacific Ocean was the only player on the field this winter then much of the US would likely experience a warmer-than-normal winter as El Nino is one of nature's best ways to redistribute heat around the world. There is an atmospheric phenomenon, however, that can counteract El Nino's potential warming in the Mid-Atlantic region during the winter season and it is known as "high-latitude blocking". As a result, it is quite important in the long-range forecasting of winter season temperatures in the Mid-Atlantic region to evaluate the prospects for “high latitude blocking”.

“High-latitude blocking” during the winter season is generally characterized by persistent high pressure in northern latitude areas such as Greenland and northern Canada. Without this type of pattern in the atmosphere, it would be quite difficult to get sustained cold air masses in the Mid-Atlantic region during the winter season; especially, during El Nino (warm) events. Coastal storms in the I-95 corridor absent sustained cold air would be much more likely to generate rain or snow changing to rain in the big cities along I-95.

The Arctic Oscillation signal and “high-latitude blocking”

“High-latitude blocking” is tracked by meteorologists through indices known as the Arctic Oscillation (AO) and its closely-related cousin called the North Atlantic Oscillation (NAO). The Arctic Oscillation refers to opposing atmospheric pressure patterns in middle and high latitudes. When the AO is positive, for example, surface pressure is low in the polar region and this helps the mid-latitude jet stream to blow strongly and consistently from west-to-east keeping Arctic air locked up in the polar region. When the AO index is negative, there tends to be high pressure in the polar regions (i.e., “high-latitude blocking”), weaker zonal winds, and greater movement of polar air into the middle latitudes. While the AO and NAO indices are primarily used during by forecasters during the winter season, trends in summer and fall seasons can provide important clues about the ensuing winter season.

Evidence shows that when AO reaches negative values on a consistent basis during the month of July, the subsequent winter season typically will have frequent “negative” AO periods which are correlated with “high-latitude blocking” patterns. As it turned out, the AO signal this past July averaged out to be one of the most negative in the past 50 years and every single one of the ten most negative AO index readings during the month of July featured negative AO index values during subsequent winters which would typically give the northeastern US plenty of cold air to work with. In addition, AO index trends in autumn seasons also have been shown to be useful predictors for subsequent winter seasons. Specifically, negative AO index values in October typically translate to negative values during the following winter season. In summary, the low mean AO value of this past summer negatively biases the upcoming winter AO and if the current negative AO persists for much of the fall, this too will likely increase the odds of negative AO during the winter season.

AO_10_13.gif

[Arctic Oscillation index (actual black; forecast red); courtesy NOAA]

The snowpack signal and “high-latitude blocking”

In addition to the Arctic Oscillation signal, snowpack in the northern hemisphere during the autumn season has also been found to be an important predictive factor with respect to “high-latitude blocking” patterns during subsequent winter seasons. In fact, research studies have actually pinpointed the region in Siberia below 60°N during the month of October as critical with respect to the likelihood of “high-latitude blocking” atmospheric patterns during the following winter season. If snowpack is above-normal and consistently expanding during October in that particular part of Siberia, research studies suggest there is an increased chance for more frequent “high-latitude blocking” configurations in subsequent winter months.

Indeed, the snow anomaly chart (below) shows above-normal snowfall at the end of September for the northern hemisphere although not quite at the extreme levels of a year ago. In addition, there has been a significant increase in snowpack across Siberia during the first half of October including in the region south of 60°N (white area in maps below) and I expect this trend to continue during the second half of the month. For Eurasia as a whole, the snowpack at the end of September was the 18th highest in the last 47 years and it was the 14th highest across the entire northern hemisphere (source Rutgers Snow Lab).

rutgers-snow.png

[Northern Hemisphere snow cover anomalies at end of September: http://climate.rutgers.edu/snowcover/chart_anom.php?ui_set=1&ui_region=nhland&ui_month=9]

Picture1.png

[Noticeable expansion of Siberian snow cover (in white) from 9/30 (left) to 10/13 (right); courtesy NOAA]

Low solar activity and “high-latitude blocking”

Research has shown that low solar activity tends to be correlated with frequent “high-latitude blocking” patterns and we are now experiencing one of the weakest solar cycles (#24) in more than a century. The “analog years” plot below shows surface-level height anomalies in low solar activity years (solar minimum phases) and high pressure dominates near Greenland and Iceland (orange, red). In addition to solar cycle 24 being a historically weak one, we have likely exited its solar maximum phase (indicated by arrow) - usually the most active time in a given solar cycle - and are now headed towards the next solar minimum. As a result, odds favor low solar activity during this upcoming winter season which has been found to be well correlated with frequent “high-latitude blocking” scenarios.

solar-analaog.png

[Typical surface height anomaly pattern during low solar activity time periods; courtesy NOAA/NCEP]

solar-cycle-24.gif

[Solar cycle 24 is historically weak and continues a weakening trend in recent solar cycles; source: http://solarscience.msfc.nasa.gov/images/Cycle22Cycle23Cycle24big.gif]

The bottom-line

Given the expected oceanic surface temperature patterns around the world for this winter season and the likelihood for “high-latitude blocking” events, I believe the Mid-Atlantic region from DC-to-Philly-to-New York City will experience normal to slightly above normal temperatures (0.0°C to +1.0°C); however, there will be occasional Arctic air outbreaks. As the winter season progresses, the weather should turn increasingly colder “relative-to-normal” in the Mid-Atlantic region following a mild November and likely a warmer-than-normal December.  

The overall weather pattern should be quite stormy with numerous coastal storms and above-normal snowfall in DC, Philly and New York City with the heaviest snow likely falling during the second half of the winter season. In addition, there is the chance for a blockbuster snow event or two given the expected “El Nino-enhanced” coastal storms and, if this were to occur, it would most likely happen during the latter half of winter. Look for at least 20-30 inches in the DC metro region during the upcoming winter season, 30-40 inches in Philly, and 35-45 inches in the NYC metro region.

Elsewhere, much of the northern US should feature above-normal temperatures while much of the southern half of the nation will be colder-than-normal. This would be a dramatic difference from recent winters in the Northern Plains and Upper Midwest where they have suffered through bitter cold weather conditions. Precipitation should be above-normal in California - alleviating their drought significantly - and higher-than-normal across the southern US and up along the eastern seaboard.

Extended Video Discussion

httpv://youtu.be/cvXqZljmtfA


Paul Dorian

Vencore, Inc.

Valley Forge, PA

9:30 AM | Tropics showing some life

Paul Dorian

2ndary_peak_of_tropical_season.png

[Climatological trend for Atlantic Basin hurricanes/tropical storms]

Discussion

Even though we have now just passed the climatological peak of the Atlantic hurricane season (approximately September 10th), there are reasons to believe that tropical activity can still have a direct impact on the US mainland as we head through the rest of summer and into the fall season. Sea surface temperatures generally are running at above-normal levels for this time of year in much of the Atlantic Basin and this should certainly help in the formation of late season tropical systems.

saharan_airmass.jpg

[Saharan air mass map; courtesy University of Wisconsin/CIMSS]

In fact, there are currently a couple of tropical waves in the Atlantic that are moving generally to the west. Indeed, there is actually a third wave just now coming off the African west coast and it is also headed in a general westward direction. The latest “Saharan air mass” map (courtesy University of Wisconsin/CIMSS) shows the current location of these tropical waves (circled) and it also suggests that these waves may not have to deal with much dry Saharan air in the near future (shown on map with orange, yellow and reds). This has not been the case for much of the summer in that most developing tropical systems during the past few months have encountered dry Saharan air in their path and this factor has inhibited growth in most cases. The bottom line, the warmer-than-normal sea surface temperatures combined with the lack of much in the way of dry Saharan air in the Atlantic Basin, suggests that the tropics will need to be closely monitored as we head towards the fall season.

Video

httpv://youtu.be/yU5-RNm-p_w

10:00 AM | An update on Tropical Storm Erika and the obstacles it faces

Paul Dorian

erika.gif

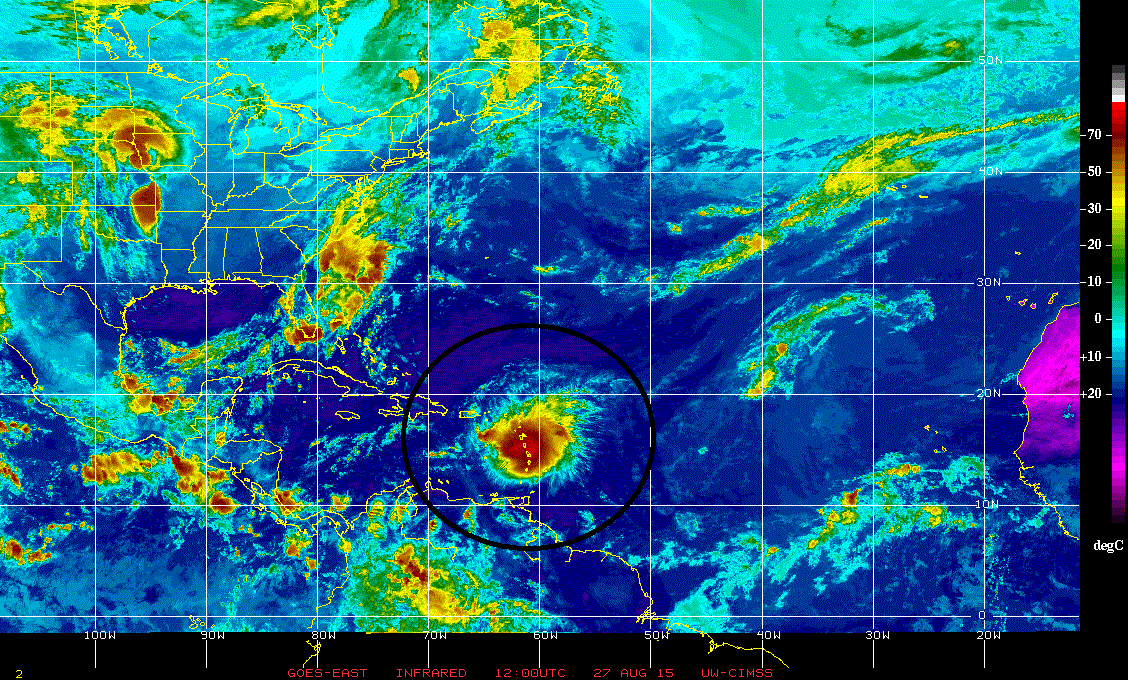
[Latest colorized IR satellite image of Tropical Storm Erika; courtesy University of Wisconsin/CIMSS]

Background

The US has not been hit by a major hurricane (i.e., category 3 or higher) since October of 2005 (Wilma) and, amazingly, Florida has not been struck by a hurricane of any intensity since the same time (and same storm). There is a chance that the hurricane drought in Florida ends by early next week, but it certainly is no guarantee and several factors can keep the drought alive for the state.

Overview

Tropical Storm Erika formed in the tropical Atlantic a couple of days ago and it appears to be headed on a track that will move it to the Bahama Islands by early in the weekend and then likely to a position off the east coast of Florida by Sunday or Monday. Steering currents in the upper part of the atmosphere to the south of a sub-tropical ridge of high pressure are likely to be flow out of the east or northeast during the next few days and this should push the system on a general west-to-northwest track. After that time, there are signs that the flow of air near the east coast will turn towards the north or northeast and this could actually push Erika away from the coastline – perhaps even before it ever makes landfall in the SE US.

Storm Intensity

As far as intensity is concerned, Erika has had trouble intensifying during the past 24 hours or so as its circulation centers have not been aligned properly for strengthening. Specifically, there has been a circulation center at lower levels of the atmosphere displaced from upper levels of the atmosphere and the best intensification usually occurs when there is one large vertically stacked central core to the storm.

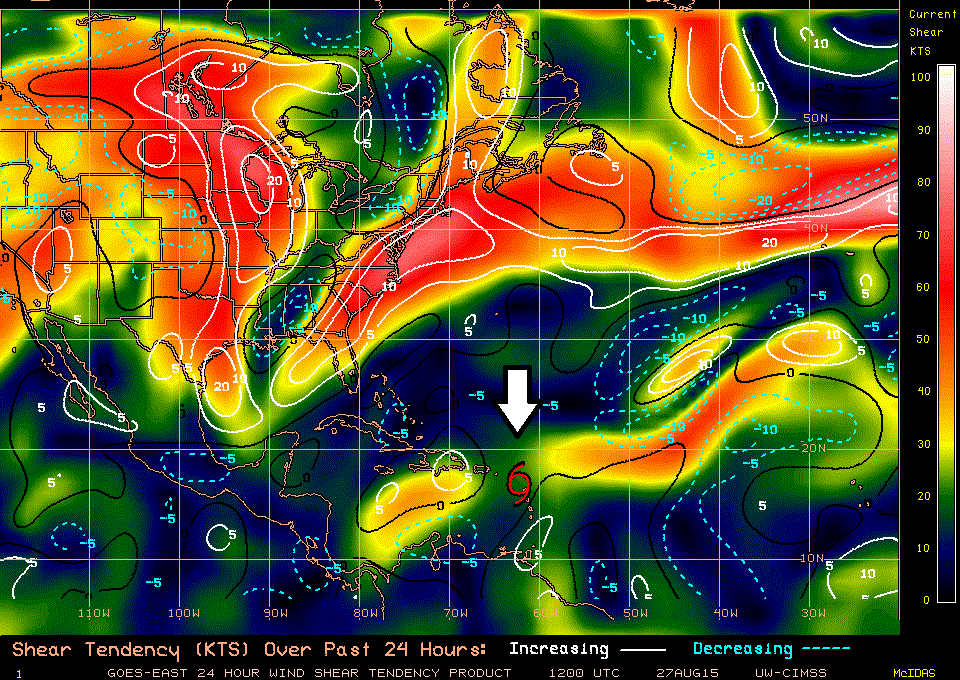
During the next two or three days, Erika will have two - and perhaps three - factors that could cause it to weaken or, at a minimum, minimize its strengthening possibilities. First, there is an area of wind shear (changing wind direction in the atmosphere) that exists around the island of Hispaniola (yellow region below; current location of Erika indicated by white arrow). Wind shear contributed to the demise of Hurricane Danny just a few days ago in the same general area and it will likely present quite an obstacle for Erika over the next 48 hours or so. Second, there is some dry air in the expected path of Erika that it will encounter in the next 48 hours or so. This dry air originated over the Saharan Desert region of Africa several days ago and - similar to the wind shear – it could contribute to some weakening of Erika. Finally, Erika’s expected general west-to-northwest track will likely take the storm very close to Hispaniola and a slight shift in the track could bring it right over the island. This island has some rather high mountains and a move by Erika over the island could very well contribute to some significant weakening.


[24-hour atmospheric shear tendency; courtesy University of Wisconsin/CIMSS]

Longer Term

After these next few days when Erika encounters some wind shear and dry air - and perhaps even takes a path over the island of Hispaniola - overall environmental conditions should become more favorable for intensification for whatever remains of Erika. However, at this time the steering currents in the the atmosphere could possibly act to push Erika away from the coastline of the Southeast US. Stay tuned…there is hope that the hurricane drought in Florida continues. [Detailed video discussion on Erika below]:

Video

httpv://youtu.be/8Lc__pNR41A