Contact Us

Use the form on the right to contact us.

You can edit the text in this area, and change where the contact form on the right submits to, by entering edit mode using the modes on the bottom right. 


123 Street Avenue, City Town, 99999

(123) 555-6789

email@address.com


You can set your address, phone number, email and site description in the settings tab.
Link to read me page with more information.

backlit-stratus-clouds-2013-04-05.jpg

Blog

Weather forecasting and analysis, space and historic events, climate information

Filtering by Category: Climate Info

12:30 PM | There is hope for a white Christmas

Paul Dorian

500mb_ht_anon_Christmas_Day[12Z GFS-ENS Christmas Day forecast for 500 mb height anomalies with an upper level trough in the eastern US and impressive blocking high pressure in eastern Canada; map courtesy tropicaltidbits.com]

Discussion

There will be a break in the overall weather pattern over the next week or so in the Mid-Atlantic region from the recent “stormy and cold” conditions to generally dry, chilly and rather uneventful. However, looking ahead to Christmas week, it appears as though the overall pattern may return to “stormy and cold” and that type of weather pattern may just continue right into the New Year.

The stalled out significant Northeast US storm that has impacted the region for the past several days is finally relinquishing control of the weather to building high pressure in the Mid-Atlantic and this will lead to a decent weekend and the nicer weather should continue right into next week. In fact, it looks relatively dry for much of next week and temperatures will gradually climb from chilly levels this weekend to slightly above normal by Tuesday afternoon.

Christmas_snow_probabilities [Probabilities for a white Christmas across the US; courtesy NOAA]

Looking ahead to Christmas week, computer forecast models tend to agree on the re-establishment of a deep trough of low pressure in the eastern US and impressive blocking high pressure in eastern Canada and this will allow for more cold air intrusions from Canada into the US and it could lead to storminess near the east coast. The 12Z GFS-Ensemble 500 millibar height anomaly forecast map (above) shows the eastern US upper-level trough of low pressure (blue) for Christmas Day and the blocking high pressure to the north (orange) - all of which indeed raises some hope for a white Christmas in the Mid-Atlantic region. Stay tuned.

Video

httpv://youtu.be/ynxOm-p2i_A

1:00 PM | *Great Lakes snow machine is running at full force...Buffalo with 4 feet of snow and counting...coldest November day across the CONUS since 1976*

Paul Dorian

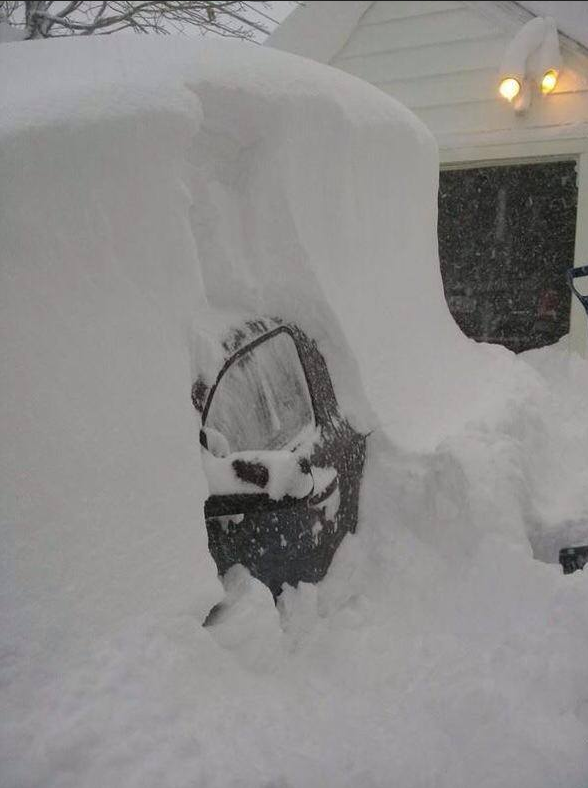
buffalo_snow[Buffalo snow as of this morning]

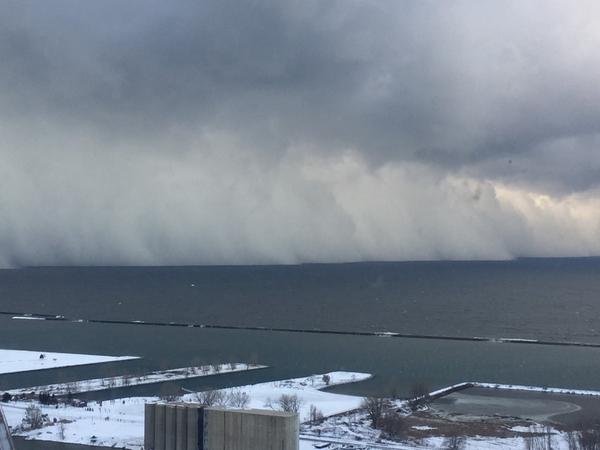
buffalo [Looking south over Lake Erie with walls of snow headed towards Buffalo]

Discussion

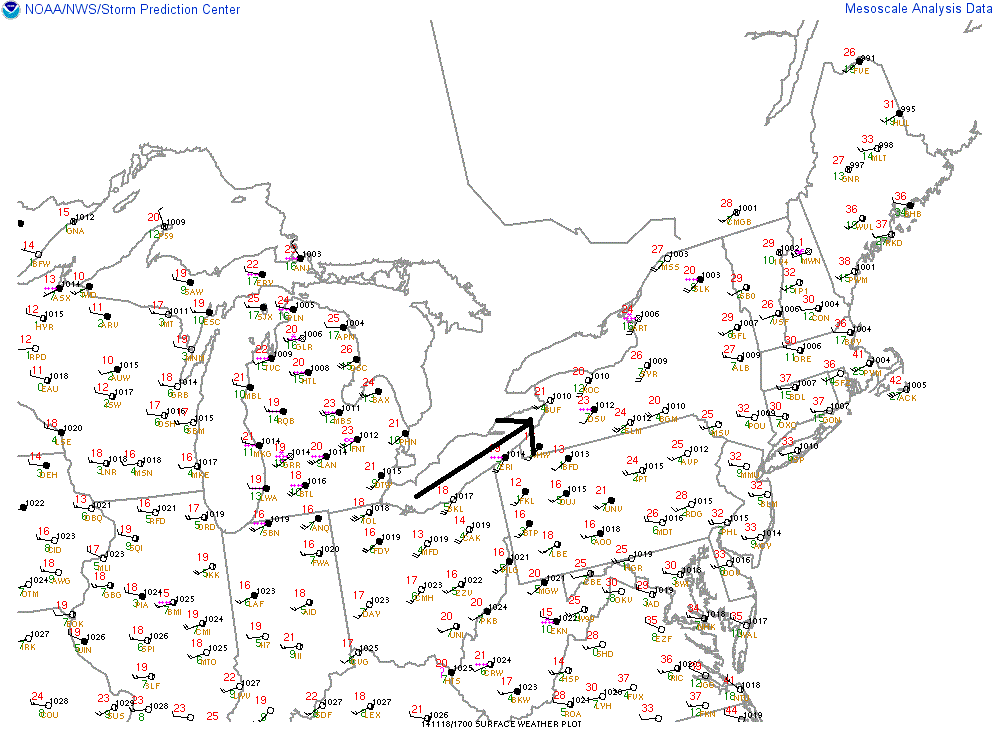
Great Lakes snow machine Talk about a perfect setup…the combination of southwesterly winds in the lower atmosphere, brutal cold Arctic air for mid-November and relatively warm Lake Erie water temperatures is producing incredible snow amounts in areas just to the south of Buffalo with 4 feet on the ground and several more feet possible over the next day or two. This setup is perfect for Buffalo to get pounded with snow as southwest winds in the lower atmosphere allow the air to flow for the longest period of time over the longest possible path across Lake Erie which is oriented southwest-to-northeast. As this air flows over Lake Erie, it picks up tons of moisture and dumps it on southwestern New York. This same type of pattern is occurring downwind of Lake Ontario in upstate New York and several feet of snow is expected just to the south of Watertown, NY as well.

sfc_map [Surface map showing southwest winds over Lake Erie which is perfect setup for Buffalo; courtesy NOAA]

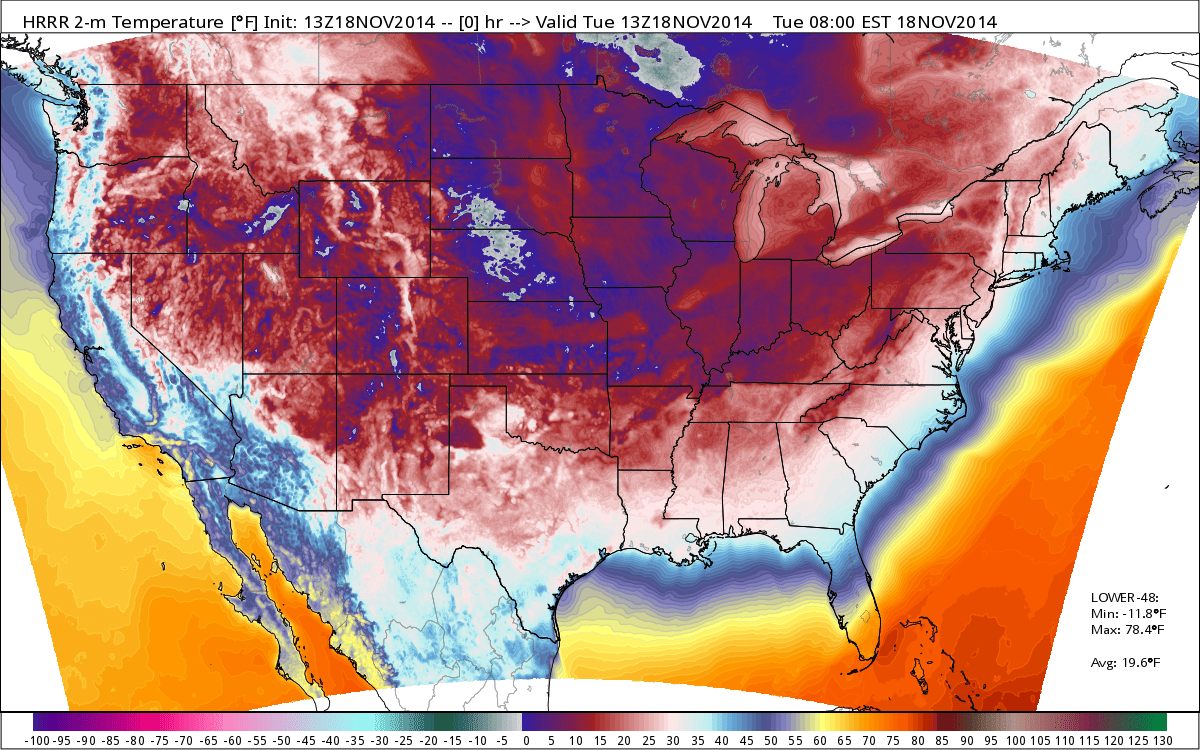
Historic Arctic blast As a whole this morning, the continental US experienced its coldest average temperature in the month of November since 1976. According to Weather Bell Analytics (weatherbell.com), the average temperature across the CONUS bottomed out earlier today at 19.4°F when more than 85% of the surface area reached or fell below freezing. All 50-states saw at or below freezing temperatures on Tuesday and should again on Wednesday. Numerous cold temperature records are likely to be broken on Wednesday from the Northeast US to the Deep South as this Arctic blast becomes well-entrenched in that part of the country.

am_lows [Coldest November day across the nation since 1976; map and data courtesy Weather Bell Analytics]

Looking ahead Milder weather is in sight. It looks like it’ll turn milder on Sunday and Monday; however, that warm up is likely to be accompanied by some more rainfall.

12:00 PM | **Heavy rainfall today and then an historic cold blast with an amazing current nationwide snow cover extent**

Paul Dorian

snowpack[Current snow cover extent in the US is 50.4%; courtesy NOAA]

Discussion

Today's heavy rainfall The evening rush hour up and down the I-95 corridor from DC-to-Philly-to-NYC will likely be quite a mess with heavy rainfall likely through much of the afternoon and early evening hours in many of these locations. All of this rainfall comes ahead of an Arctic blast that’ll arrive in the overnight hours and it will turn out to be an historic cold blast in many areas of the eastern half of the nation over the next couple of days.

Historic Arctic blast In this part of the country, several records are in jeopardy during this upcoming cold snap that will feature the coldest air seen around here since February. What is coming our way? It is currently 12 degrees in Minneapolis, Minnesota with winds gusting to 26 mph - and its only mid-November. The most likely time for record-challenging cold around here is likely to come on Wednesday as temperatures should bottom out in the teens in the overnight hours leading into the early morning. The record low at Philly Airport (PHL), for example, on Wednesday, November 19th is 20 degrees set in 1936 and this one is in jeopardy. Dulles (IAD), VA has a chance to break the record for its coldest low and high temperature on both Tuesday and Wednesday. BWI Airport in Maryland has a good chance to have its coldest November 18 on record (Tuesday), as well as its coldest low and high temperature on November 19 (Wednesday). Amazingly, the high temperature expected tomorrow in DC (maybe only as high as freezing) is 10 degrees colder than the average high temperature in mid-January. State College, PA will be lucky to see their high temperature reach the lower 20's on Tuesday and their record low maximum is 27 degrees set in 1903.

This historic Arctic outbreak will not only affect the Mid-Atlantic region, but will extend from the northern Plains to the Deep South over the next few days. In fact, record lows will be challenged on multiple occasions through midweek from eastern Texas to the Carolinas with lows near freezing along much of the Gulf Coast. Parts of northern Florida may even have their first freeze of the season as lows dip down into the 20s in cities such as Jacksonville and Tallahassee.

Amazing current US snow cover Not surprisingly, the snow cover across the country has expanded significantly during the past 7 days or so. In fact, the current snow cover extent across the nation is around 50.4% which is the most we’ve seen (by a long shot) in the first half of November since 2003, when the National Snow Analysis archive begins. Only the year 2012 comes close to this year’s 50.4 percent coverage — on Nov. 12, 2012, 31.5 percent of the lower 48 was covered in snow. The normal snow cover extent nationwide at Christmas-time is around 33%. By the way, ice is already starting to appear on Lake Superior and it should expand significantly over the next few days. Last winter's relentless cold caused some record ice cover amounts in all five of the Great Lakes.

Looking ahead Milder weather is in sight for the eastern half of the nation. It looks like it’ll turn milder late this weekend and early next week; however, that warm up is likely to be accompanied by some more rainfall.

sat [Clouds associated with the Arctic front extend from the Gulf of Mexico to New England; courtesy NOAA]

1:00 PM | Superstorm about to impact the Bering Strait and it will have ramifications on our weather

Paul Dorian

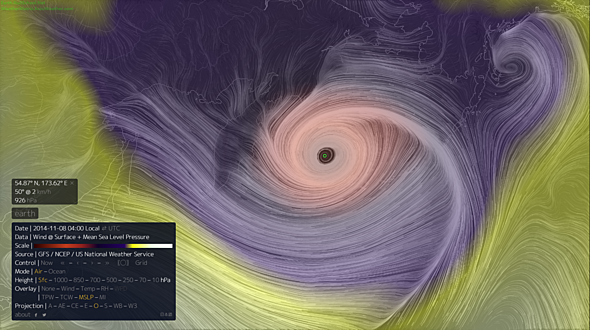
depiction_of_the_forecasted_wind_field[Depiction of the forecasted wind field associated with this superstorm near Alaska; courtesy earth.nullschool.net]

Discussion

One of the most intense storms ever is about to move over the Bering Sea and it will have an impact on our weather in the eastern US in coming days. The Bering Sea is one of the stormiest parts of our planet, but it has rarely seen a storm like this and there is a chance that it could feature atmospheric pressure not seen this low in many decades in this part of the world.

Computer forecast models have been signaling for days that the remains of Typhoon Nuri will undergo a transition over the next few days into an extratropical storm as it moves away from Japan. As it does, unusually strong upper-levels winds across the North Pacific will help to intensify the system in a dramatic fashion – perhaps from around 970 millibars today to 925 millibars by tomorrow night. In fact, if it bottoms out at 925 millibars tomorrow night then it would tie the record for the lowest pressure ever recorded in the Bering Sea. The current record holder is 925 millibars and was set in October 1977 (in Dutch Harbor, Alaska). Note- as a point of reference, the lowest pressure recorded with Hurricane Sandy was 940 millibars. The storm will bring howling winds of up to 80 mph or so to the Aleutian Island chain and to the western part of the Alaskan mainland. Seas are forecast to build to at least 50 feet in the southwest Aleutians and perhaps even higher than that in the Bering Strait.

As far as possible ramifications on our weather…many times we’ve talked about “teleconnections” here at "VecnoreWeather.com" in which an event on one part of the world has an effect on another part of the world several days later. Indeed, this deep trough of low pressure developing in the Northern Pacific will likely translate downstream into a deep trough across the central and eastern US in coming days. In fact, it appears the reincarnation of Typhoon Nuri and some other atmospheric factors will lead to multiple rounds of Arctic air outbreaks into the Midwest and eastern US during the remainder of the month of November. One such major cold air outbreak is destined to reach the Mid-Atlantic region around Wednesday of next week.

11:30 AM | *Major cold wave invades the nation next week as overall weather pattern looks increasingly winter-like*

Paul Dorian

AO[Arctic Oscillation index: actual (black), forecast (red); courtesy NOAA]

Discussion

A couple of weeks ago, Vencore Weather put out the 2014-2015 Winter Outlook calling for a cold and snowy winter in the Mid-Atlantic region with a quick start including some notable cold and snow in December - well that last part of the winter outlook may just have to be revised slightly as the unfolding weather pattern could actually bring the real start of winter to this month rather than waiting for December.

To begin with, the Arctic Oscillation (AO) index which was highlighted in the Winter Outlook discussion is about to tank once again into deep negative territory which is suggestive of “high-latitude blocking” in the upper atmosphere of the higher latitudes and this usually is followed by Arctic air outbreaks into the northern US. Indeed, blocking in the higher latitudes will force an Arctic air mass to plunge into the mid-section of the country by next Tuesday and that impressive major cold air outbreak will likely reach the Mid-Atlantic region at mid-week. Next week’s early season Arctic air outbreak will be backed up by a monster high pressure system of 1040 millibars or higher and has the potential to produce record-breaking cold in much of the eastern half of the nation.

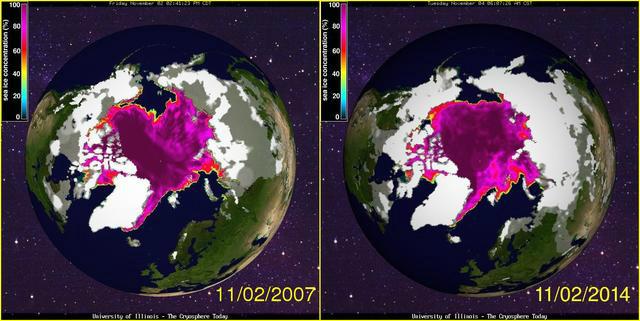
In addition to the AO, another important factor for our potential winter weather is the snowpack across Eurasia and the entire northern hemisphere as we approach the winter season. Indeed, at the end of October, the snowpack levels were quite impressive in our usual cold air source regions. Statistics gathered by the Rutgers Snow Lab in New Jersey show that the end-of-October snowcover is the 3rd highest in the last 47 years for the northern hemisphere and 2nd highest across Eurasia in that same time period. All of this bodes well for cold and snow in the northeastern US during the upcoming winter as described in detail in the Winter Outlook discussion. The plot below displays the northern hemisphere snowcover as of November 2nd for 2014 (right) and 2007 (left) - notice the significantly higher amounts of snow throughout Eurasia (white area) and even on this side of the north pole at this crucial time of year heading into the winter season.

snowfall [Northern hemisphere snowcover comparison for 2007 and 2014; data courtesy University of Illinois "cryosphere"]

2014-2015 Winter Outlook: http://vencoreweather.com/2014/10/15/1200-pm-2014-2015-winter-outlook-by-vencore-weather-looks-cold-and-snowy-for-the-mid-atlantic-region/

10:00 AM | 2014 - another down year in the US for tornadoes, hurricanes, extreme heat, wildfires and drought

Paul Dorian

Discussion

Overview Whether you’re talking about tornadoes, hurricanes, extreme heat, wildfires or drought, there is good news this year in that similar to last year, these extreme weather-related events are down in the U.S. compared to normal and, in the case of land falling major hurricanes, to historically quiet levels.

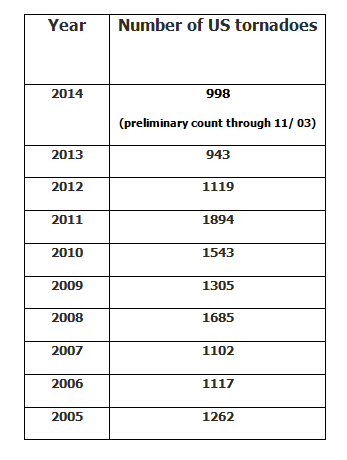
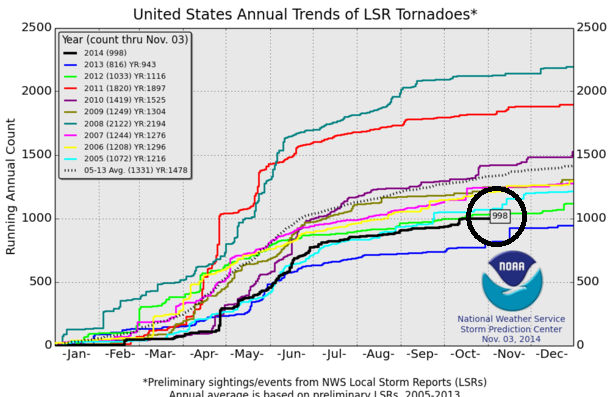
Tornadoes To begin with, the number of tornadoes in the US this year is on pace to be one of the lowest totals in the last ten years and well below the 9-year average (2005-2013) of 1478. The table below lists the number of tornadoes in the US for this year (preliminary count through 11/03) and full-year totals going back to 2005 [Data source: NOAA, http://www.spc.noaa.gov/climo/online/monthly/newm.html; http://www.spc.noaa.gov/wcm/]

table1

tornadoes

Hurricanes As far as hurricanes are concerned and keeping in mind that the Atlantic Basin tropical season isn't quite over yet, the 2014 hurricane season has generally been a quiet one for the continental U.S. and below normal for the Atlantic Basin as a whole. As of November 3rd, there have been eight named storms this year in the Atlantic Basin - Arthur, Bertha, Cristobal, Dolly, Edouard, Fay, Gonzalo and Hanna. Six of these storms became hurricanes and two reached major hurricane status (category 3 or higher), but only Arthur impacted the continental US (Outer Banks of North Carolina). In terms of Accumulated Cyclone Energy, or ACE, this tropical season in the Atlantic Basin is only 67% of normal when using the 1981-2010 time period for comparison (Data source: Dr. Ryan Maue at Weather Bell Analytics; http://models.weatherbell.com/tropical.php). ACE is a commonly-used metric for activity because it is not dependent on exact numbers of named storms or hurricanes, but rather is based on both the intensity and longevity of all tropical storms and hurricanes (so a long-lived tropical storm could contribute as much ACE as a short-lived storm that reached hurricane intensity).

An interesting stat with respect to US hurricanes has to do with the fact that we are currently in the longest period since records began without a major hurricane strike in the US (i.e., category 3, 4 or 5). The last major hurricane to strike the US was Hurricane Wilma during late October of the record-breaking year of 2005 - let’s hope this historic stretch continues. October 24th marked the 9th anniversary of the last major hurricane hit in the US, the last one being Wilma in the southwestern part of Florida. Florida has, in fact, quite amazingly now gone through their longest stretch ever without a hurricane of any kind – nine years as of October 24th – with the next longest streak in records dating back to 1851 being just five seasons from 1980-1984. In 2004 and 2005 alone, seven hurricanes hit Florida (Charley, Frances, Jeanne, and Ivan in 2004; Dennis, Katrina, and Wilma in 2005).

By the way, just as another point of comparison, in 1954 the US was hit by 3 major hurricanes in less than 10 weeks.

florida [Running 9 year mean in Florida]

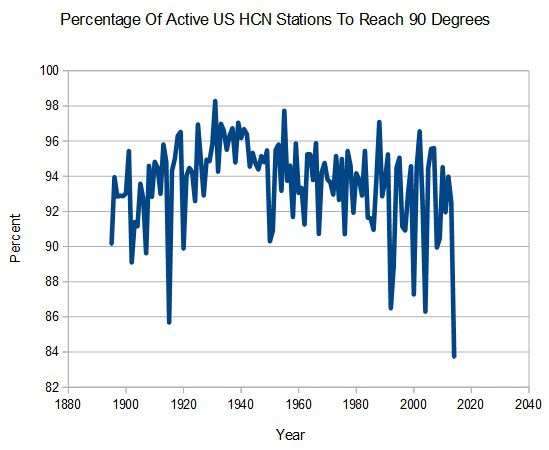
Extreme Heat In addition to tornadoes and hurricanes, extreme heat is also down across the US this year when looking at frequency of 90 degrees days at all of the US Historical Climate Network (HCN) stations going back to the late 1800’s and this continues a long-term downward trend since the 1930’s. In fact, the percentage of US HCN stations to reach 90 degrees so far this year (through 10/24) has been the smallest on record. The most widespread heat occurred in 1931, when more than 98% of stations reached 90 degrees.

90 deg days

(Data source: NOAA, USHCN reporting stations; Steve Goddard, http://stevengoddard.wordpress.com/2014/10/25/us-having-its-coolest-year-on-record/ )

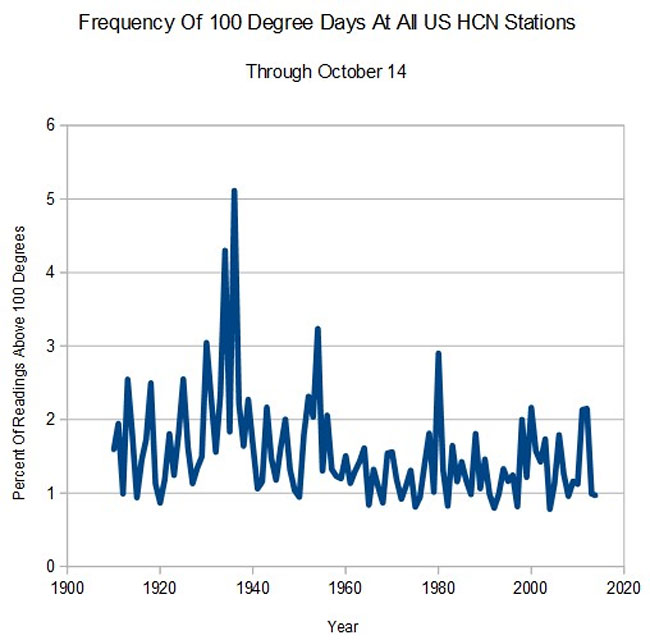
This year also continues a downward trend in the frequency of 100 degree days since the 1930’s as seen in the chart below. The five summers with the highest number of 100 degree days across the US are as follows: 1936, 1934, 1954, 1980 and 1930.

100 deg days (Data source: NOAA, US HCN reporting stations; Steve Goddard)

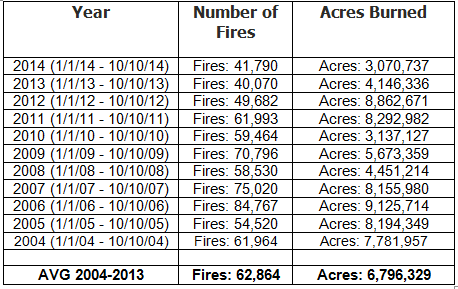
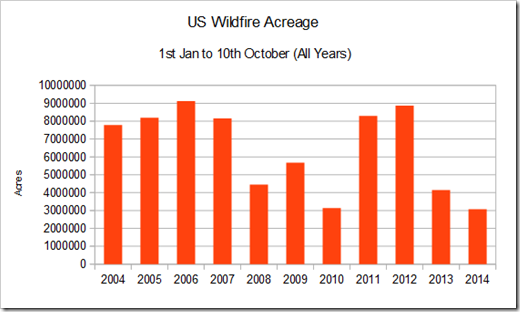
Wildfires As far as wildfires are concerned, the amount of acres burned across the US was the lowest in the last eleven years through October 10th and the number of wildfires was the second lowest in that same time period – both well below the 2004-2013 average (table below).

table 2 (Data source: National Interagency Fire Center; http://www.nifc.gov/fireInfo/nfn.htm, http://www.nifc.gov/)

US wildfires

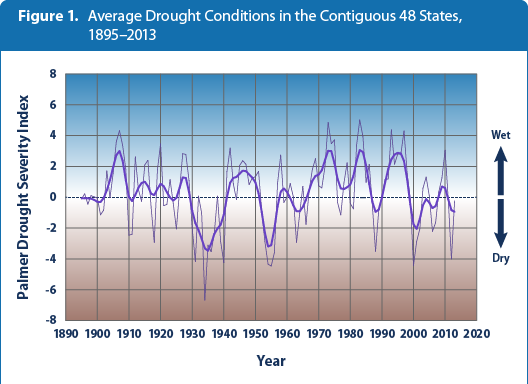
Drought Finally, despite the fact that much of California is suffering through severe drought, 63% of the country had no drought conditions as of October 28th and this is even higher than one year ago at this same time when about 48% of the country had no drought conditions (data source: http://droughtmonitor.unl.edu/Home/TabularStatistics.aspx; Roger Pielke, Jr). This actually continues a longer-term trend which shows a rather benign look to the Palmer Drought Severity Index in the last several years across the contiguous US (values generally between +1 and -1 since around 2001). The most severe drought conditions in the contiguous US occurred during the middle 1930's and then again in the middle 1950's when the Palmer Drought Severity Index dropped below -3.

US drought trends

Paul Dorian/Meteorologist VencoreWeather.com on Facebook, Twitter and liveweatherblogs.com paul.b.dorian@vencore.com

9:30 AM | Some amazing early season snow and cold

Paul Dorian

lows[Record or near record lows from yesterday and this morning; data courtesy coolwx.com]

Discussion

Heavy snow fell this weekend throughout the Great Smoky Mountains National Park which straddles the border region between Tennessee and North Carolina with up to nearly two feet reported in some of the highest elevation locations (e.g., 22 inches at Mt LeConte, TN). Heavy snow was also reported on sections of the Blue-Ridge Parkway connecting the Shenandoah National Park in southwestern Virginia to the Great Smoky Mountains National Park. Up to six inches of snow fell around Asheville, North Carolina while 3 inches were measured in Boone, North Carolina. Seven inches fell near Marshall, North Carolina (elevation 2280 feet) and up to 3 inches blanketed Bluefield, West Virginia.

Perhaps the most amazing feature about this weekend’s early season snow and cold was that accumulating snow fell in lower elevation locations across South Carolina and even was seen all the way to the coastline where Charleston saw its earliest snow on record. Columbia, South Carolina recorded its earliest snowfall ever (see picture below) with as much as 4.5 inches measured just southwest of the capital city. There have been only two other Novembers since the 1800s with snow accumulation in the city according to the National Weather Service. The previous benchmark for earliest snowfall in Columbia, SC was November 9, 1913.

Columbia [Snow-covered Columbia, South Carolina]

As the powerful storm that contributed to all of this early season snow and cold exited off to the northeast late yesterday, significant snow fell throughout much of Maine with a foot measured at Bangor and there was even some small snow accumulation in and around the Boston metro region. Bangor (12 inches) and Caribou (10.1 inches), Maine both set their record earliest double-digit snowfall days, besting records from Nov. 15, 1962 and Nov. 20, 1945, respectively, according to the National Weather Service office in Caribou.

In addition to the snow, cold was record-breaking in many southeastern US locations this weekend and into this morning. The plot above displays the widespread record or near record low temperature locations (blue circled regions) from yesterday morning and this morning (data courtesy coolwx.com). Some examples of record-setting cold on Sunday included Macon, Georgia at 29 degrees, Vero Beach, Florida at 41 degrees and Tampa, Florida recorded its lowest high temperature for the date at 67 degrees breaking a record held there since 1895. More record lows were set this morning in the Southeast US including Ocala, Florida at 37 degrees.

12:00 PM | 2014-2015 Winter Outlook by Vencore Weather...looks cold and snowy for the Mid-Atlantic region

Paul Dorian

Discussion

Looks like the Mid-Atlantic region - and much of the eastern half of the nation - is going to experience another cold and snowy winter…

Overview Last winter, much of the eastern half of the nation including the Mid-Atlantic region suffered through colder-than-normal conditions with the most severe cold relative-to-normal centered over the Upper Midwest and Great Lakes. The phrase “polar vortex” became part of the vernacular when it came to talking about the winter weather in the central and eastern US. Most of the same area also experienced above-normal snowfall with Philadelphia’s International Airport recording it 2nd snowiest ever at 68” - second only to 2009-2010 when 78.7” piled up. Reagan National Airport in Washington, DC had its 9th snowiest winter ever with 32”, and Central Park in New York City measured well-above normal amounts of 57.4”.

There are several factors listed below that point to another cold and snowy winter in the Mid-Atlantic region which would give us “back-to-back” cold and snowy winters – not all that uncommon in this part of the country (e.g., 1976-1977/1977-1978; 1983-1984/1984-1985):

1. Strong positive (warm) sea surface temperature anomaly in the northern Pacific Ocean 2. A weak-to-moderate “centrally-based” El Nino (warm) in the tropical Pacific Ocean 3. Favorable conditions for “high-latitude blocking” (low solar activity, above-normal and "expanding" autumnal snowpack, October Arctic Oscillation index signal)

Pacific Ocean sea surface temperature (SST) anomalies Last winter featured a strong positive anomaly in sea surface temperatures in the northern Pacific Ocean and all indications are that this same anomalous pattern will continue through the upcoming winter season. Meanwhile, farther south in the tropical Pacific, there is a new feature for this winter as weak-to-moderate El Nino conditions (i.e., warmer-than-normal SSTs) have developed and should last through the winter season before perhaps withering away later next year. Currently, the center of the above-normal sea surface temperature pattern in the tropical Pacific is close to the west coast of South America; however, computer forecast models (e.g. CFSv2, JAMSTEC) suggest the weak-to-moderate El Nino should become “centrally-based” during the winter season with the warmest waters relative-to-normal shifting from the eastern Pacific to the central Pacific.

The combination of a “centrally-based” El Nino in the tropical Pacific along with the warm anomaly in the northern Pacific is likely to lead to an upper air pattern that consistently features high pressure ridging along the west coast of North America and low pressure troughing in the eastern US. This kind of upper air pattern typically allows for the frequent penetration of cold, Canadian air masses into the central and eastern US from northern Canada - as was the case quite often last winter. The similarities are truly remarkable between the expected Pacific Ocean SST anomaly pattern for this upcoming winter (warm pocket up north and "centrally-based" weak-to-moderate El Nino near the equator) and the actual one that occurred during the fifteen coldest winters in the past 60 years (see video discussion for details).
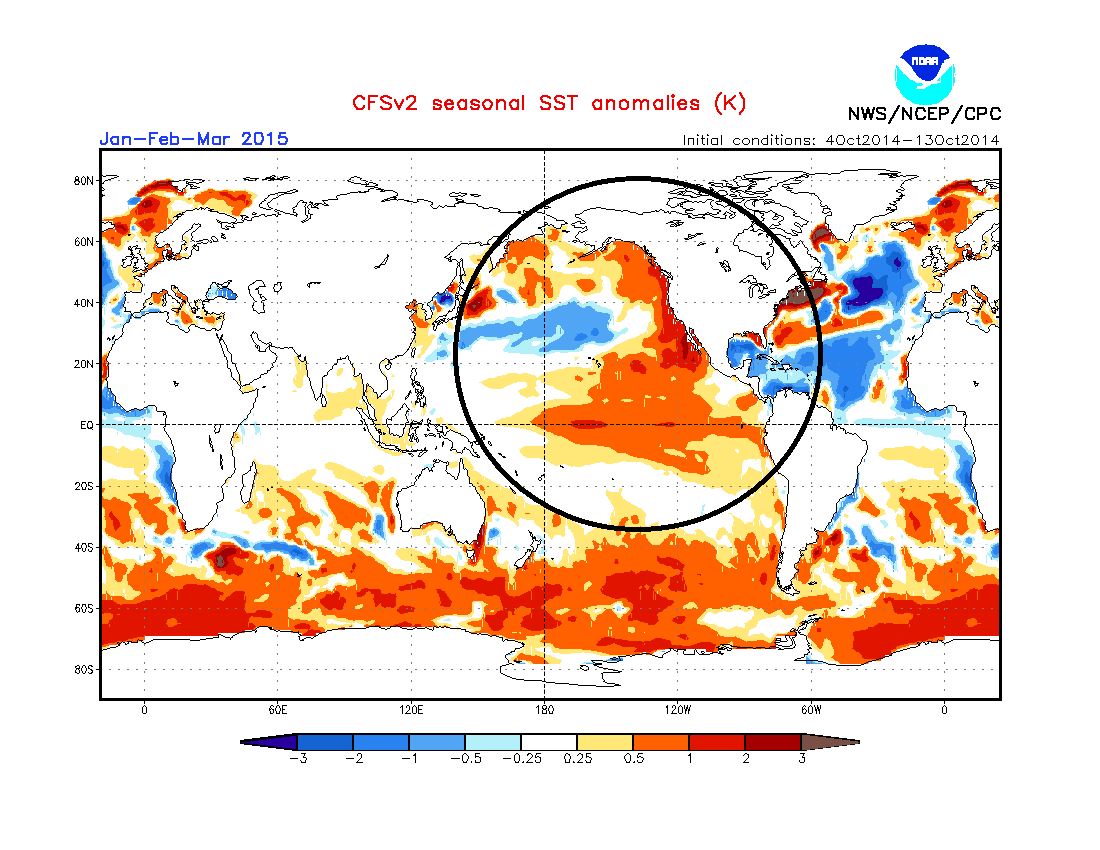
cfs [CFSv2 SST anomalies forecast for Jan-Feb-Mar 2015; courtesy NOAA]

“High-latitude blocking” and low solar activity In addition to the sea surface temperature anomaly pattern in the Pacific Ocean, “high-latitude blocking” is another important factor with regard to winter weather forecasting in the central and eastern U.S. “High-latitude blocking” is generally characterized by persistent high pressure in northern latitude areas such as Greenland and this typically leads to cold air outbreaks into the central and eastern U.S from northern Canada. Research has shown that low solar activity tends to be correlated with high-latitude blocking patterns and despite the fact that we are in the solar maximum phase of solar cycle 24, it is actually a period of relatively low solar activity as this solar max is one of the weakest in many decades - perhaps even the weakest in more than a century – and low solar activity is expected to continue through the winter season.

“High-latitude blocking” and the northern hemisphere snowpack Some research studies have documented a connection between northern hemisphere snowpack during fall seasons and “high-latitude blocking” patterns in following winter seasons. Specifically, if snowpack is above-normal and consistently expanding during the fall season in many of our cold air source regions (e.g. Canada, Greenland, Siberia) then there is an increased chance for more frequent “high-latitude blocking” patterns in subsequent winter months. North America snow cover extent actually reached record highs at the end of September in records dating back all the way to 1967 (data courtesy Rutgers snow lab at http://climate.rutgers.edu/snowcover/chart_anom.php?ui_set=1&ui_region=namgnld&ui_month=9) and the entire northern hemisphere had its 3rd highest levels at the end of the month.
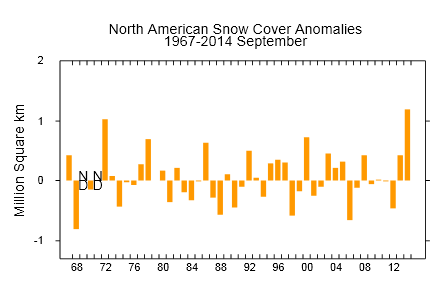
NA [North American snow cover anomalies at end of September (record high); courtesy Rutgers snow lab]

As far as October is concerned, the snow coverage in Eurasia (Asia in particular) is off to the races. The all-important cold air source region of Siberia has experienced consistent expansion (southward of 60°N) of its snowpack during October and research has correlated this type of autumnal snowfall in this precise part of the world with more frequent wintertime “high-latitude blocking” patterns in following winter months. In many parts of Siberia, the snow cover has rapidly advanced in recent days to levels not seen at this stage of the autumn season since at least the year 2000.
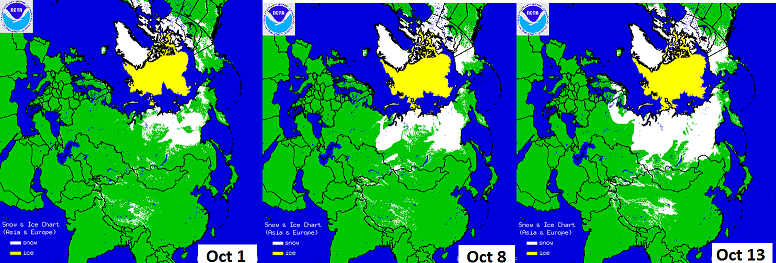
Siberia snow [Expansion of Siberian snow cover (in white) from early-to-mid October; courtesy NOAA]

The Arctic Oscillation index and its October signal for “high-latitude blocking” High-latitude blocking can be tracked by meteorologists through indices known as the Arctic Oscillation (AO) and its closely-related cousin called the North Atlantic Oscillation (NAO). When the AO is positive, for example, surface pressure is low in the polar region and this helps the mid-latitude jet stream to blow strongly and consistently from west-to-east keeping Arctic air locked up in the polar region. When the AO index is negative, there tends to be high pressure in the polar regions (i.e., “high-latitude blocking”), weaker zonal winds, and greater movement of polar air into the middle latitudes. While the AO index and its closely-related cousin called the North Atlantic Oscillation (NAO) are primarily used during the winter season, trends in October can provide important clues about the ensuing winter season.

Indeed, earlier in October, the AO plunged into negative territory not seen during the month of October in over a decade. The map below shows the observed AO index value (in black) as it bottomed out at -4 on October 9th before an upturn. The lowest level ever seen for the AO index in the month of October which was -5.09 recorded on October 18th, 2002. In fact, the last time the AO was lower than -3.5 during the month of October was in 2002 and there have only been five times where the AO index has been below -4.0 during the month of October. As it turns out, when we look at the winters since 2002 that experienced an AO index below -2 during the month of October, almost every one (6 out of 7) experienced above-normal snowfall in the Mid-Atlantic region and below-normal temperatures. For example, snowfall in New York City for these particular 7 winters had an average snowfall total of 40 inches compared to the normal amount of ~25 inches and only one of those winters included below-normal snowfall. The AO and NAO indices are likely to spend much of the time this winter in negative territory indicative of frequent “high-latitude blocking” patterns. By the way, the all-time low for the AO index in any month came during the brutally cold month of January 1977 when it bottomed out at a value of -7.43.
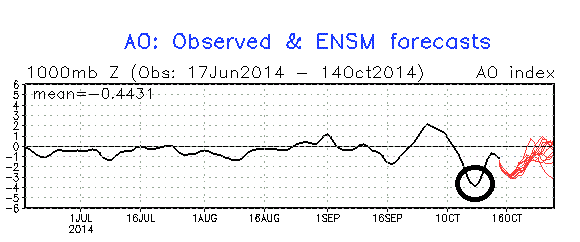
AO [Arctic Oscillation index (actual black; forecast red); courtesy NOAA]

The bottom-line Much of the eastern two-thirds of the nation should experience another colder-than-normal winter season with the western-third of the nation (Denver-to-Los Angeles) likely to be warmer-than-normal. Overall temperatures in the Mid-Atlantic region should end up about 1.5-3.0 (degrees Celsius) below-normal for the winter season (November through March) and similar chill relative-to-normal can be expected all the way down to the Gulf coast.

Snowfall should be at least ten inches above normal amounts in the Mid-Atlantic region this winter with more than 25 inches likely in the DC metro region, more than 30 inches in and around Philly, and more than 35 inches in the New York City metro region. The winter is likely to get off to a quick start with some notable cold and snow following what is likely to be a relatively mild beginning to the month of November in the Mid-Atlantic region.

Video

httpv://youtu.be/41CDNlIzvRA

12:45 PM | "Long-lost" satellite images shed new light on global sea ice...enormous holes found in the Arctic ice back in the 1960's...Antarctica sea ice reached record highs and lows just two years apart

Paul Dorian

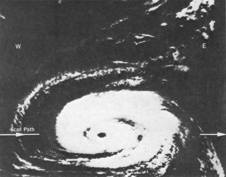
Nimbus[Hurricane Gladys as seen by NASA’s Nimbus 1 satellite in September 1964; courtesy NASA]

Discussion

Overview NASA launched the first of seven Nimbus spacecraft to study Earth from space in August 1964 and fifty years later experts at the National Snow and Ice Data Center in Boulder, Colorado are recovering long-lost images from old Nimbus data tapes and black-and-white film. The preliminary findings from long-lost images from the 1960’s have produced some big surprises with respect to global sea ice. In much the same way archeologists dig up artifacts that can rewrite history, these long-lost satellite images have to potential to rewrite our knowledge of ever-changing global sea ice cycles.

The Nimbus program Fifty years ago NASA launched the first in a series of Earth-observing satellites that revolutionized how scientists study Earth’s weather systems, environment and atmosphere. The Nimbus satellites were a series of seven Earth-observation satellites launched over a 14-year time period from 1964 to 1978, one of which did not achieve orbit. In total, the satellites provided Earth observations for 30 years and collectively carried a total of 33 instruments, including ozone mappers, the Coastal Zone Color Scanner instrument and microwave and infrared radiometers. The Nimbus series were the first meteorological satellites to provide day and night local area coverage every 24-hours, repeated at the same time daily. This “sun-synchronous” orbit became the norm for satellites in subsequent years. Nimbus were also the first satellites to provide day and nighttime pictures of intense hurricanes as viewed from space which initiated the use of satellite technology to provide hurricane warnings (example image above). Many at NASA's Goddard Space Flight Center (Greenbelt, MD) regard Nimbus as the "granddaddy of the current Earth-observing fleet" and the overall program as a "smashing success and a huge return on investment".

Nimbus satellite observations were transmitted as an analog signal and then burned onto film and stored in canisters labeled only by orbit number (i.e., no indication of geography). The only way to retrieve this imagery data into usable format by specific land area was to scan all of it which meant 250,000 images. Now the satellite imagery data is completely digital and can be managed and manipulated by scientists in order to get a look at the past. Initial work with the newly-digitized satellite data has been performed for the 1964-1969 time period and now the year 1970 is being analyzed.

Global Sea Ice In terms of global sea ice, our current satellite data records are quite good for a little more than the past 30 years or so. Pushing it back another 15 or 20 years could be crucial in the understanding of global sea ice cycles which have been occurring throughout history. Indeed, early findings have been quite surprising with respect to both the Arctic and Antarctica sea ice extent. According to NASA scientists, while there was more ice compared to today, there have been “enormous holes" found in the Arctic ice that "we didn’t expect and can’t explain” in a decade considered to be colder-than-normal (i.e., the 1960's). The Antarctica sea ice extent findings are perhaps even more amazing. Using these long-lost satellite images, it appears that the Antarctica sea ice extent reached record high levels in 1964 only to be followed by record low amounts just two years later in 1966, and the earliest maximum sea ice extent was seen in 1969. As is often the case with more data, it often leads to more questions than answers. Video discussion on this by NASA scientists at http://www.youtube.com/watch?v=bvGIE1y3cXA.

1:15 PM | Important October clue about a possible snowy winter - the plunging Arctic Oscillation (AO) index

Paul Dorian

AO_fcst[GFS model forecast of the Arctic Oscillation (AO) index to the middle of October]

Discussion

There is an index called the Arctic Oscillation (AO) which is defined by surface atmospheric pressure patterns and it is tracked closely by meteorologists during winter seasons as it can provide clues as to whether Arctic air has the potential to be transported from the northern latitudes to the middle latitudes. When the AO is positive, for example, surface pressure is low in the polar region and this helps the mid-latitude jet stream to blow strongly and consistently from west-to-east keeping Arctic air locked up in the polar region. When the AO index is negative, there tends to be high pressure in the polar regions, weaker zonal winds, and greater movement of polar air into the middle latitudes. While the AO index and its closely-related cousin called the North Atlantic Oscillation (NAO) are primarily used during the winter season, trends in October can provide important clues about the soon-to-follow winter season. Indeed, the AO is about to plunge into territory not seen during the month of October in over a decade and there is an outside chance it reaches record low territory for the month of October.

The map above shows the observed AO index value (black) up to the current date and then the forecasted values (in red) to the middle of the month. The AO is forecasted to plunge over the next couple of weeks to around -5 (legend at left) which is very close to the lowest level ever seen for the AO index in the month of October which was -5.09 recorded on October 18th, 2002. In fact, the last time the AO was lower than -3.5 during the month of October was in 2002 and there have only been five times where the AO index has been below -4.0 in October. By the way, the all-time low for the AO index came during the brutally cold month of January 1977 with a value of -7.43.

As it turns out, when we take a look at the winters since 2002 that featured an AO index below -2 during the month of October, almost every one (6 out of 7) experienced above normal snowfall in much of the Mid-Atlantic region and usually below-normal temperatures as well. Stay tuned…Vencore Weather winter outlook coming in November.