
1:00 PM | Global sea ice surges to above-normal levels seen rarely in recent years
Paul Dorian
 [Yellow line represents southern hemisphere sea ice areal extent throughout 2014; courtesy University of Illinois "cryosphere"; NOAA/NCEP]
Discussion
Overall Summary Southern Hemisphere sea ice areal extent continues to run at or near all-time record high levels in the satellite data era (circled area above) for this particular time of year in records going back to 1979. The northern hemisphere sea ice areal extent continues to run at below normal levels; however, it is well above levels seen on this particular date during the past several years. Overall, the global sea ice areal extent has surged into “above-normal” territory (below) that has been seen rarely during the past several years.
 [red line represents global sea ice areal extent relative-to-normal (zero line); courtesy University of Illinois "cryosphere"; NOAA/NCEP]
Southern Hemisphere Sea Ice The rather remarkable period of consistently higher-than-normal sea ice areal extent in this part of the world actually began a few years ago. Back in 2011, the southern hemisphere sea ice areal extent was still at below-normal levels, but it has surged in recent years to nearly 1.5 million square kilometers above the 1979-2008 mean (data courtesy University of Illinois "cryosphere" web site with data originating from NOAA/NCEP Snow and Ice Data Center).
Northern Hemisphere Sea Ice The northern hemisphere sea ice areal extent is still below normal (circled area below) relative to all years going back to 1979 although it is well above the lowest point set during 2012 and noticeably above levels seen earlier this year. The northern hemisphere sea ice areal extent is currently about 0.5 million square kilometers below normal using the base period of 1979-2008 for comparison (data courtesy University of Illinois "cryosphere" web site with data originating from NOAA/NCEP Snow and Ice Data Center).
The northern hemisphere sea ice areal extent has generally trended lower since the mid 1990’s reaching primarily below-normal levels after the turn of the century. In the past several years, however, there has been a leveling off of that downward trend in terms of sea ice areal extent at those below-normal levels. In the time period before the mid 1990’s, the sea ice areal extent was generally above-normal dating back to 1979. The directional shift in the sea ice areal extent trendline that developed during the mid 1990’s in the northern hemisphere correlates quite well with a northern Atlantic Ocean sea surface temperature cycle that is tracked by meteorologists through an index called the Atlantic Multidecadal Oscillation (AMO). Indeed, Atlantic Ocean sea surface temperature anomalies play a critical role in the overall northern hemisphere sea ice areal extent. The AMO index flipped in phase during the mid 1990’s from negative (cold) to positive (warm) and the sea ice areal extent trendline changed direction at precisely that point in time. Once the northern Atlantic sea surface temperatures flip back to cooler-than-normal levels – perhaps in the next few years or so - the northern hemisphere sea ice areal extent should return to the normal or above-normal levels seen prior to the mid 1990’s.
 [Yellow line represents northern hemisphere sea ice areal extent throughout 2014; courtesy University of Illinois "cryosphere"; NOAA/NCEP]
 [Polar view of current stratospheric (10-millibars) temperature pattern and the 10-day forecast using the GFS model; courtesy NOAA]
 [Stratospheric (10-millibars) temperature plot for 2013 and 2014 in high latitude region of 90N to 65N; courtesy NOAA]
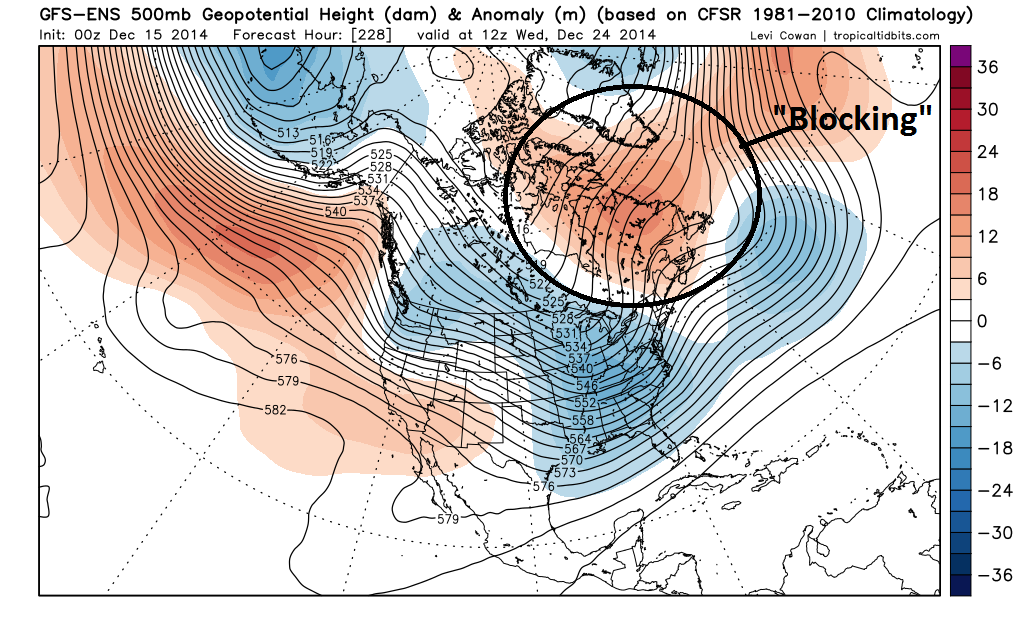 [00Z GFS-Ensemble 500 mb height anomaly forecast for Christmas Eve (12/24); map courtesy "tropicaltidbits.com"]
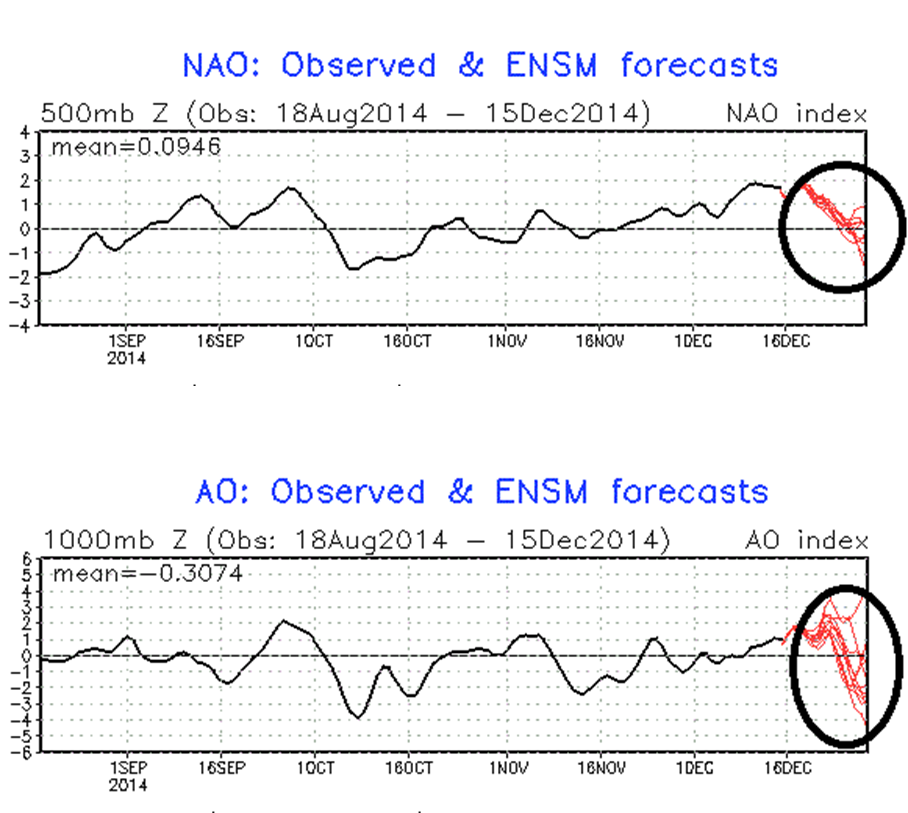 [North Atlantic Oscillation index and Arctic Oscillation index forecasts; courtesy NOAA]
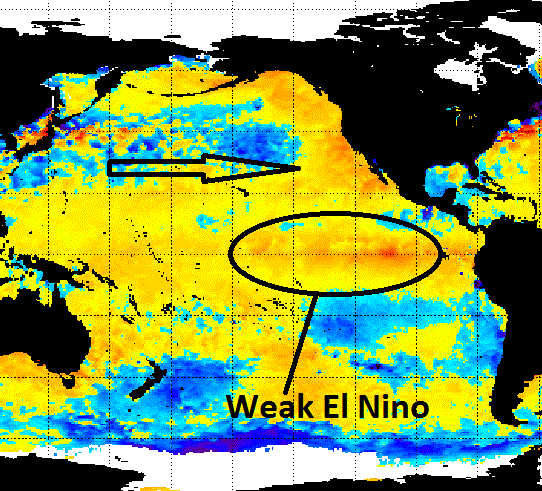 [Current sea surface temperature anomalies; courtesy NOAA]
 [12Z GFS-ENS Christmas Day forecast for 500 mb height anomalies with an upper level trough in the eastern US and impressive blocking high pressure in eastern Canada; map courtesy tropicaltidbits.com]
 [Probabilities for a white Christmas across the US; courtesy NOAA]
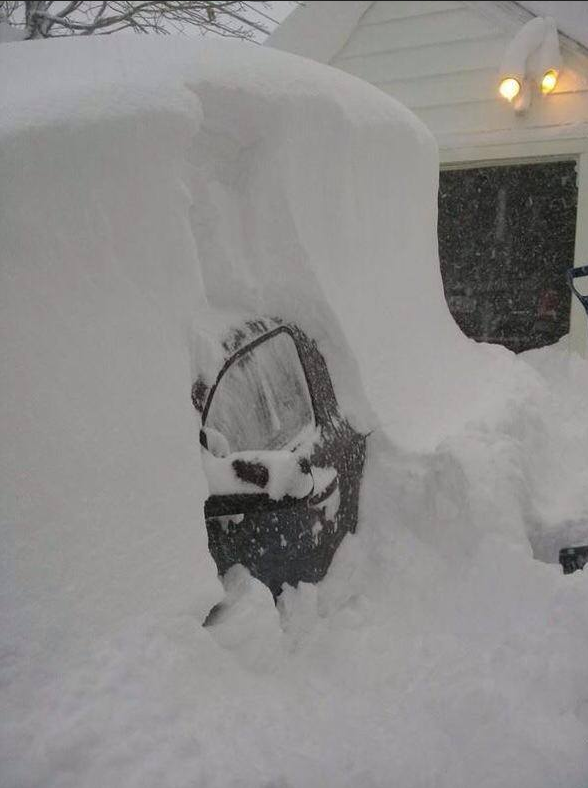 [Buffalo snow as of this morning]
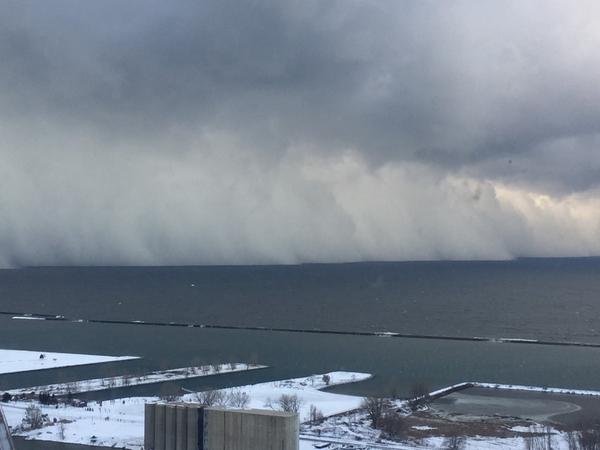 [Looking south over Lake Erie with walls of snow headed towards Buffalo]
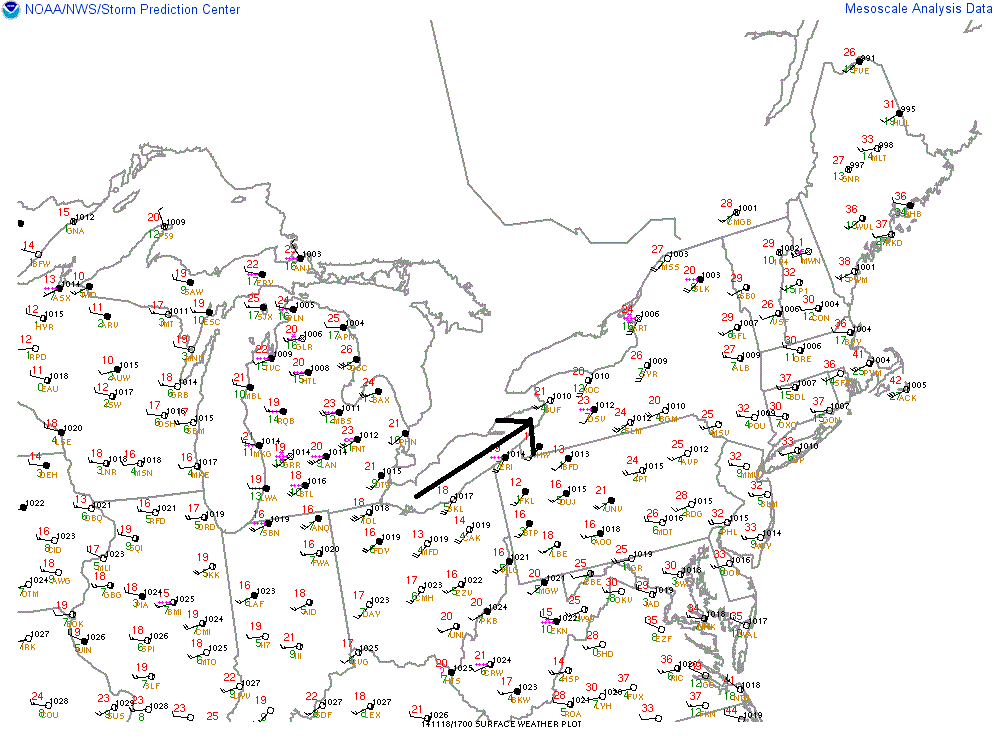 [Surface map showing southwest winds over Lake Erie which is perfect setup for Buffalo; courtesy NOAA]
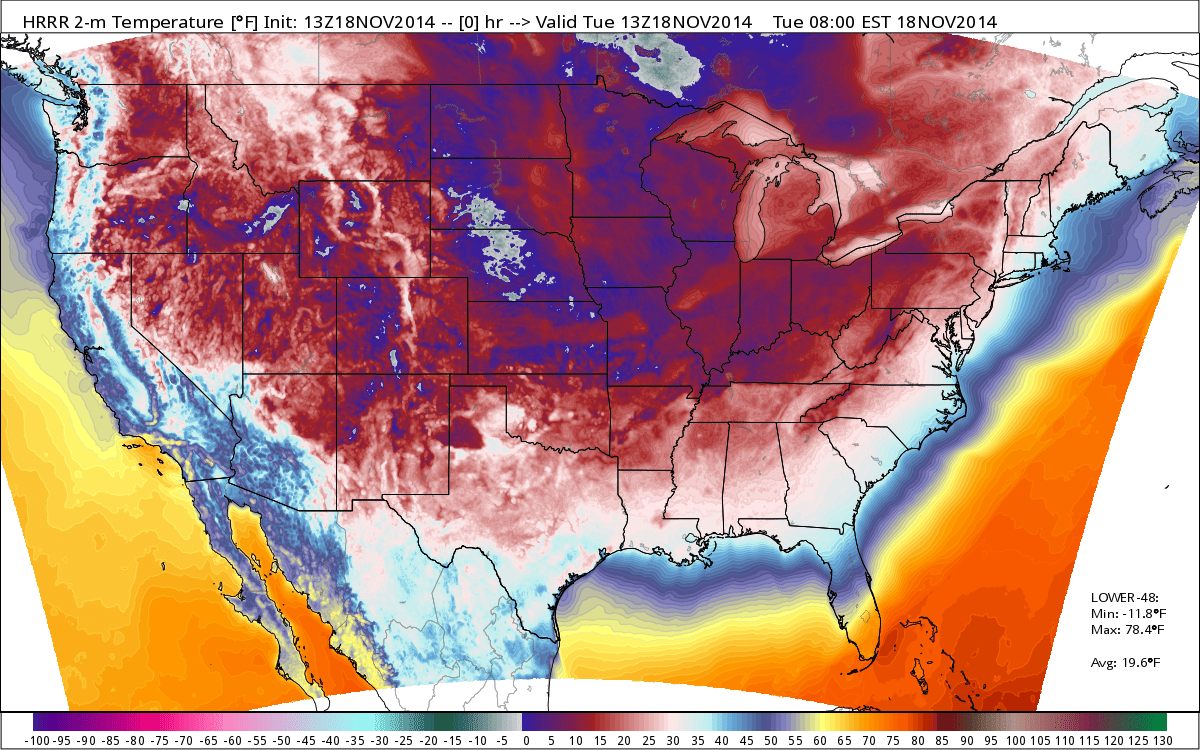 [Coldest November day across the nation since 1976; map and data courtesy Weather Bell Analytics]
 [Current snow cover extent in the US is 50.4%; courtesy NOAA]
 [Clouds associated with the Arctic front extend from the Gulf of Mexico to New England; courtesy NOAA]
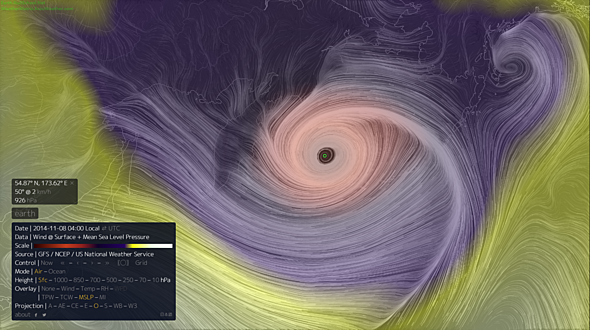 [Depiction of the forecasted wind field associated with this superstorm near Alaska; courtesy earth.nullschool.net]
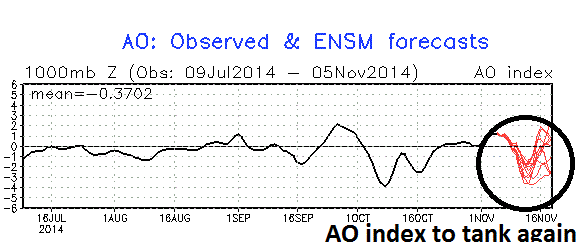 [Arctic Oscillation index: actual (black), forecast (red); courtesy NOAA]
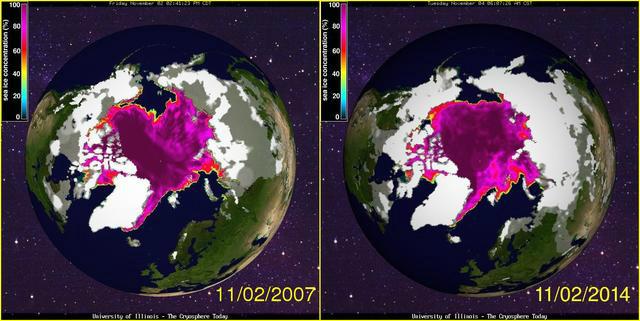 [Northern hemisphere snowcover comparison for 2007 and 2014; data courtesy University of Illinois "cryosphere"]
 [Running 9 year mean in Florida]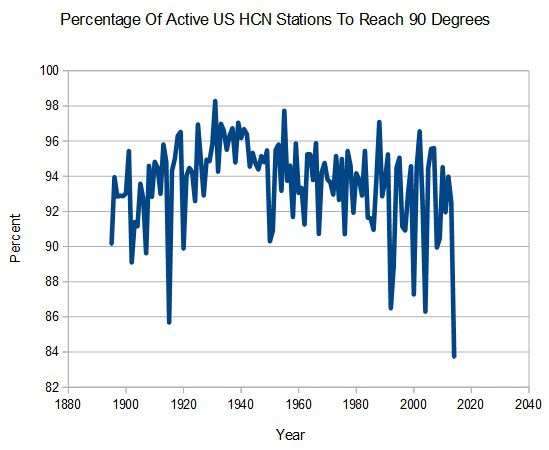
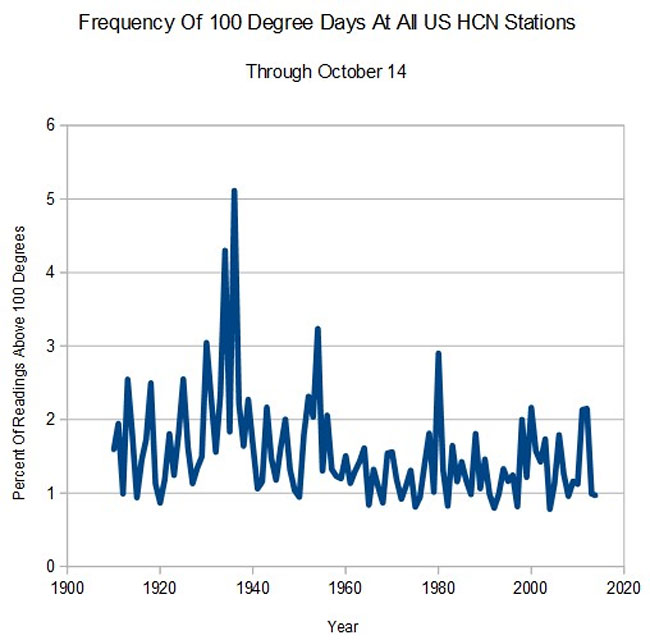 (Data source: NOAA, US HCN reporting stations; Steve Goddard)
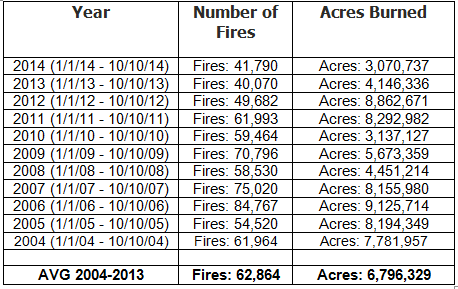 (Data source: National Interagency Fire Center;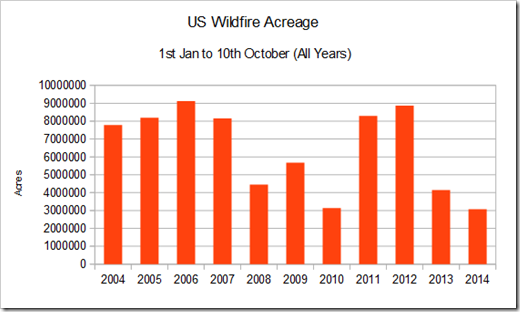
 [Record or near record lows from yesterday and this morning; data courtesy coolwx.com]
 [Snow-covered Columbia, South Carolina]