
10:00 AM | ****Unfolding weather pattern to bring significant snow and brutal cold to the Mid-Atlantic region during the next few weeks and perhaps right through the month of February****
Paul Dorian
Discussion
Overview Some winters in the Mid-Atlantic region never bring significant snow. Some winters never feature the brutal cold that winter can offer. It is quite likely that we’ll get to experience both significant snow and brutal cold here in the Mid-Atlantic region during the next few weeks and that type of pattern with snow and cold could actually last right through the month of February. There will be numerous snow threats along the way beginning with the one from this evening into Saturday and then a second from Sunday night into Monday. In addition, brutal cold air outbreaks are likely to make numerous visits here as well during the next couple of weeks with the first one to arrive by Tuesday of next week. In fact, low temperatures by Wednesday morning could be sub-zero in many parts of the Northeast US and single digits in the I-95 corridor region from DC-to-Philly-to-NYC.
An especially interesting and scary-looking time period will be as we end January and begin February. Not only are there signs for a major coastal storm around February 1st (Super Bowl Sunday) or so, but brutal cold is likely to follow during the first few days of February that could bring temperatures to near zero again in many places across the Northeast US (see forecast map below for 2-meter temperature anomalies in the 5-day period from 2/2 to 2/7).
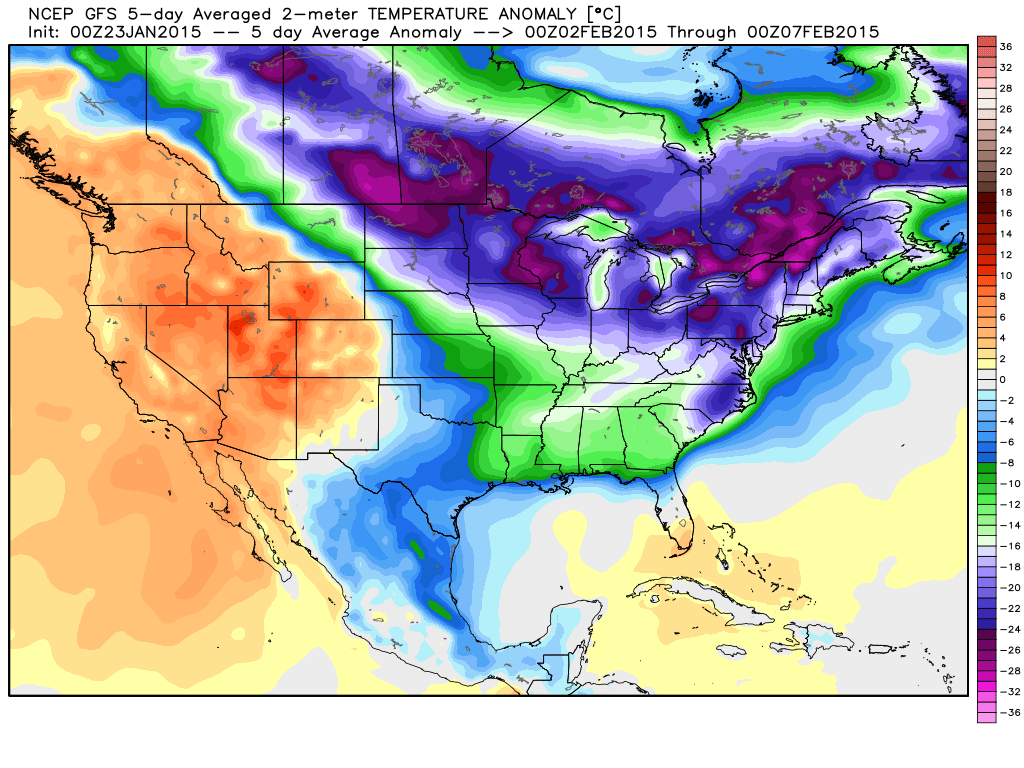 [GFS 2-meter temperature anomaly forecast map for 5-day period of 2/2-2/7; map courtesy Weather Bell Analytics at weatherbell.com]
Temperatures and the connection to the 500 millibar height anomaly pattern One week ago we discussed the likelihood for strong ridging to develop along the west coast of North America as we progress into the latter part of January. Indeed, the forecast map (below) from yesterday’s 12Z GFS Ensemble run for February 1st continues to insist on strong ridging (oranges) along the west coasts of Canada and the US and this type of upper air pattern usually leads to multiple Arctic air mass incursions into the northern US from northern Canada. In fact, this forecast map suggests that the upper-level winds at 500 millibars – which tend to follow the height anomaly lines - could actually bring air directly from the North Pole into the northeastern US by the beginning of February.
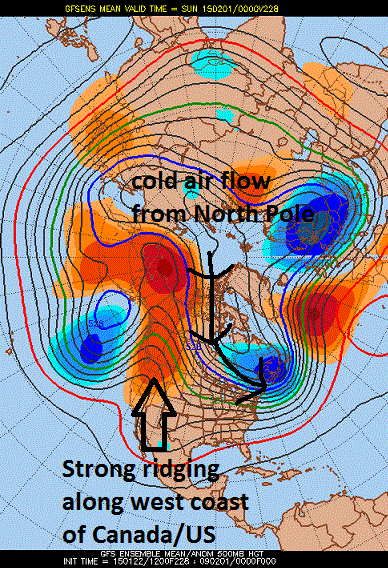 [GFS Ensemble height anomaly forecast map for February 1st; courtesy Penn State eWall]
Short-term snow threats Tonight/Saturday Precipitation from an intensifying coastal storm should reach the DC metro region early this evening (5pm or so), the Philly region between 9pm – 11pm, and NYC between 1 and 3am. The main thumping of snow from this system will be on its front end before a changeover takes place to freezing rain and sleet and perhaps even to plain rain from the cities to the coast. This event is likely to end in the DC metro region by early tomorrow afternoon, late afternoon in Philly and early evening in NYC. Snow and ice accumulation estimates are as follows:
1-3 inches in the northern and western suburbs of the District; lesser amounts in DC and points south and east 3-6 inches in the Philly and NYC metro regions and in their northern and western suburbs; lesser amounts to the south and east
Sunday night/Monday Another system will drop southeastward across the Great Lakes region late Sunday in much the same manner as some of the recent “clippers”. This system, however, has more potential than those as it will intensify in the Mid-Atlantic region on Monday, tap into some coastal moisture, and will have a cold air mass in place as it arrives. As a result, snow is likely to be the dominate precipitation type with this system on Sunday night and Monday and anywhere from several inches of snow are possible from DC-to-Philly-to-NYC. There is quite likely to be a significant disruption with the Monday morning commute due to the snowfall.
Buckle up, it’s going to be a wild ride.
Video
httpv://youtu.be/clS8roYhJ8k
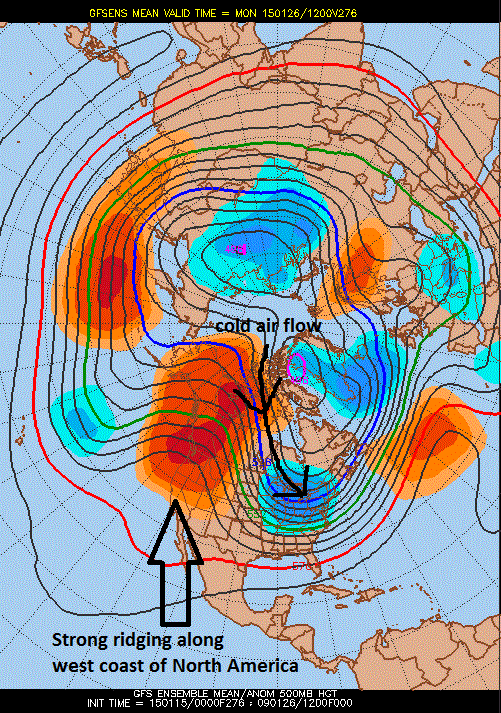 [00Z GFS Ensemble forecast map of 500 millibar height anomalies late this month; map courtesy Penn State eWall]
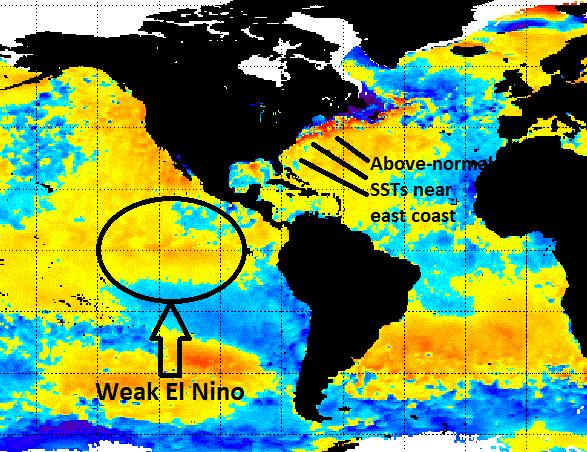 [Current sea surface temperature anomaly chart; courtesy NOAA]
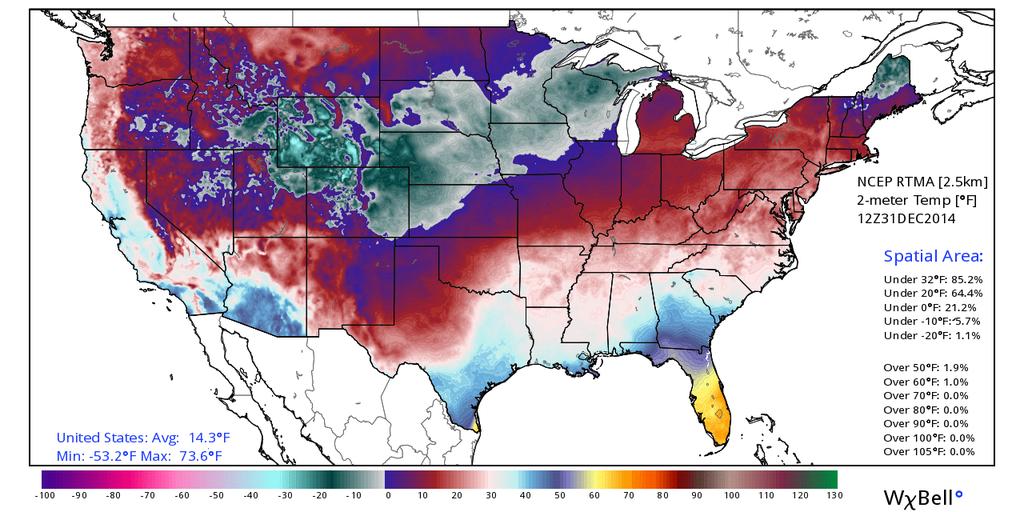 [7AM temperature map across the nation with average CONUS temperature of 14.3°F; map and data courtesy Ryan Maue of Weather Bell Analytics at "weatherbell.com"]
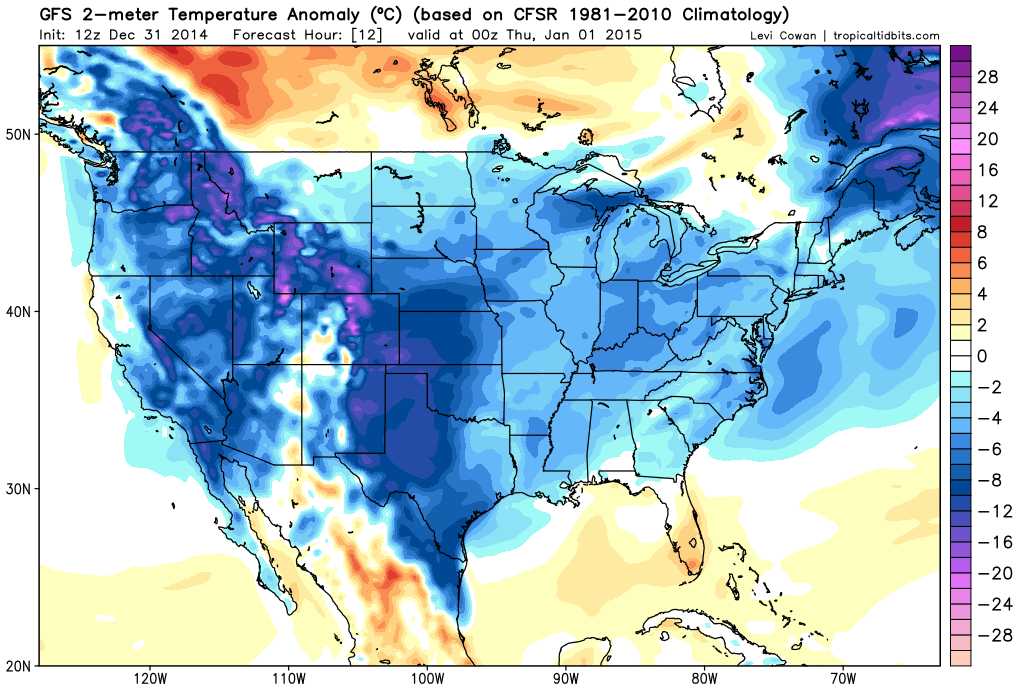 [12Z GFS 2-meter temperature anomaly forecast map for early tonight; map courtesy "tropicaltidbits.com"]
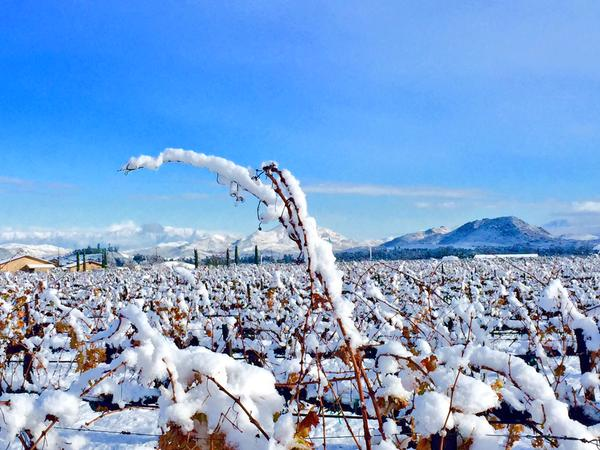 [Southern California (Temecula) vineyard in the deep freeze this morning]
 [Yellow line represents southern hemisphere sea ice areal extent throughout 2014; courtesy University of Illinois "cryosphere"; NOAA/NCEP]
 [red line represents global sea ice areal extent relative-to-normal (zero line); courtesy University of Illinois "cryosphere"; NOAA/NCEP]
 [Yellow line represents northern hemisphere sea ice areal extent throughout 2014; courtesy University of Illinois "cryosphere"; NOAA/NCEP]
 [Polar view of current stratospheric (10-millibars) temperature pattern and the 10-day forecast using the GFS model; courtesy NOAA]
 [Stratospheric (10-millibars) temperature plot for 2013 and 2014 in high latitude region of 90N to 65N; courtesy NOAA]
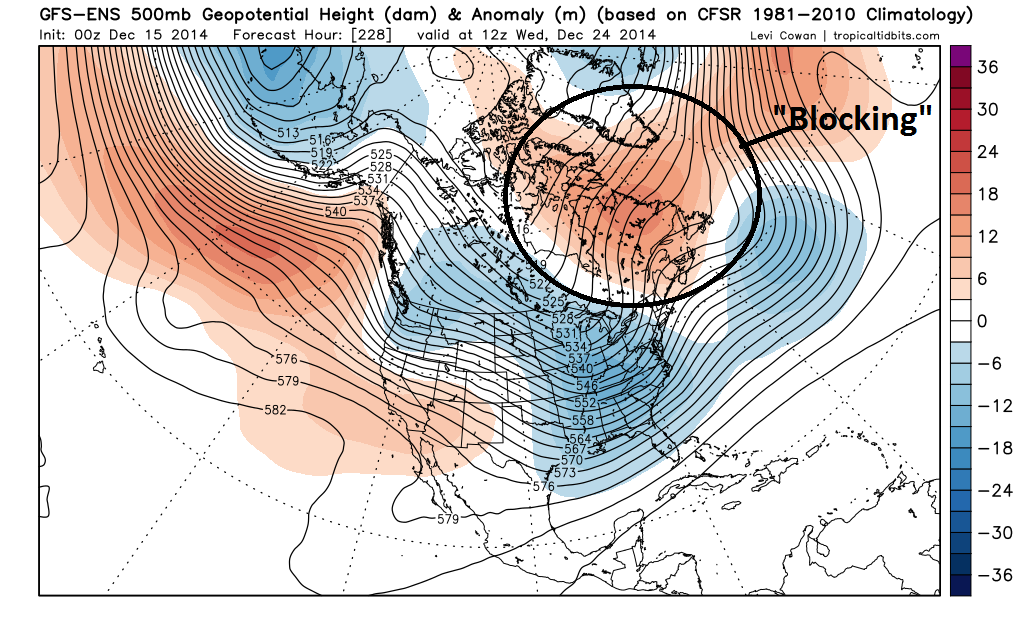 [00Z GFS-Ensemble 500 mb height anomaly forecast for Christmas Eve (12/24); map courtesy "tropicaltidbits.com"]
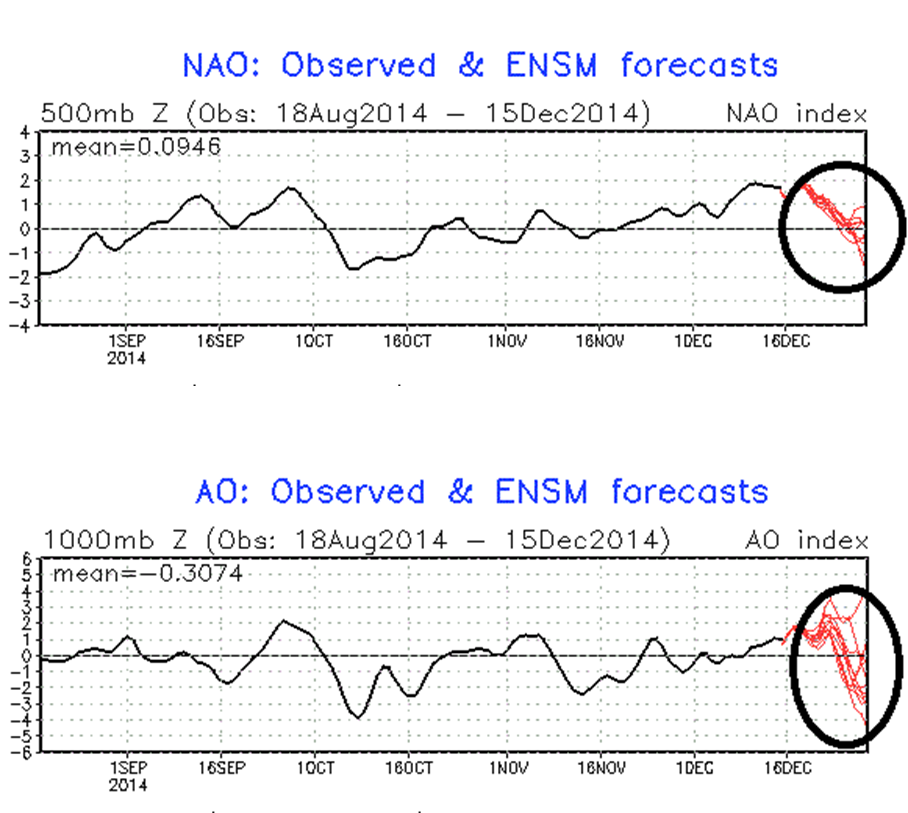 [North Atlantic Oscillation index and Arctic Oscillation index forecasts; courtesy NOAA]
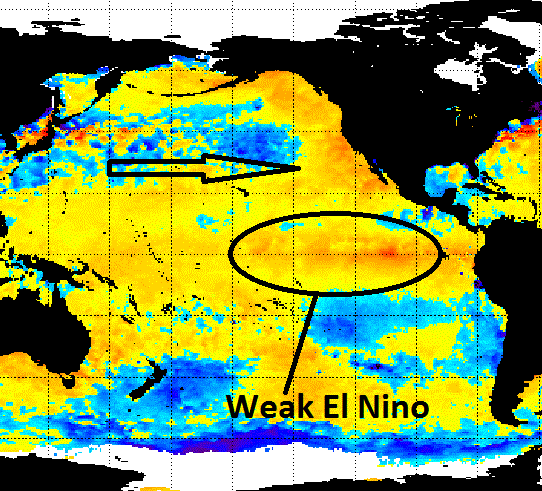 [Current sea surface temperature anomalies; courtesy NOAA]
 [12Z GFS-ENS Christmas Day forecast for 500 mb height anomalies with an upper level trough in the eastern US and impressive blocking high pressure in eastern Canada; map courtesy tropicaltidbits.com]
 [Probabilities for a white Christmas across the US; courtesy NOAA]
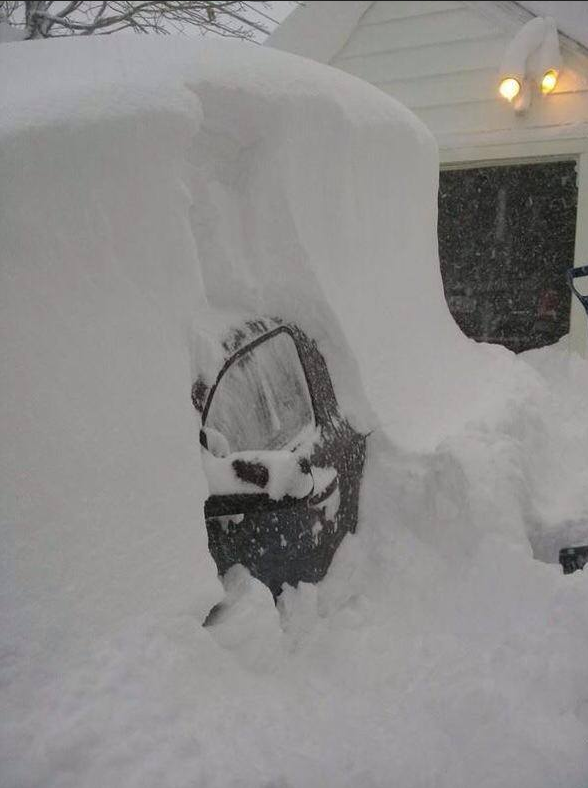 [Buffalo snow as of this morning]
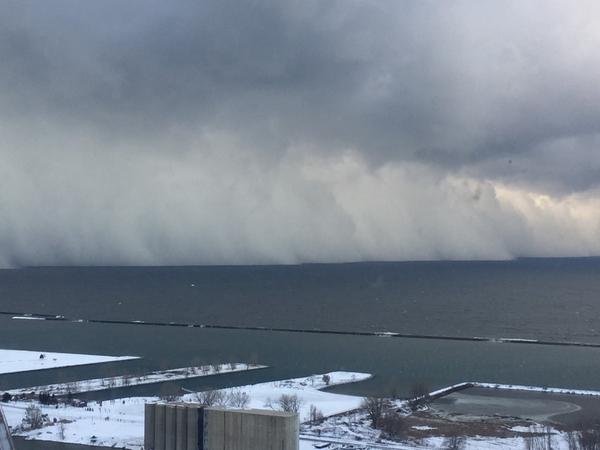 [Looking south over Lake Erie with walls of snow headed towards Buffalo]
 [Surface map showing southwest winds over Lake Erie which is perfect setup for Buffalo; courtesy NOAA]
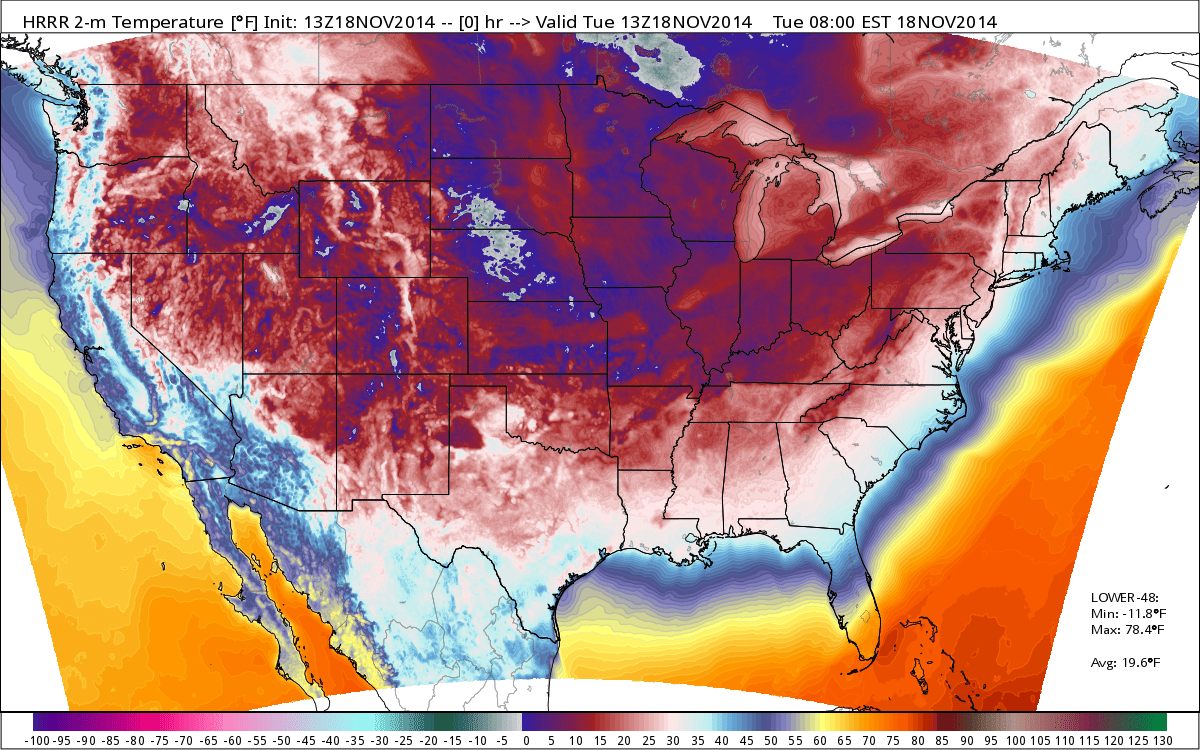 [Coldest November day across the nation since 1976; map and data courtesy Weather Bell Analytics]
 [Current snow cover extent in the US is 50.4%; courtesy NOAA]
 [Clouds associated with the Arctic front extend from the Gulf of Mexico to New England; courtesy NOAA]