
10:00 AM | Stratospheric warming and the MJO: two far apart signals that suggest colder-than-normal weather in the northeastern US continues right through February and perhaps well into March
Paul Dorian
Discussion
Overview January 2015 was colder-than-normal in the northeastern US and it looks like that type of pattern may continue through February and perhaps well into March as well. Two separate signals that are far apart on the planet suggest cold weather could indeed continue in the northeastern U.S. for the foreseeable future. The first signal is coming from a tropical disturbance known as the Madden Julian Oscillation (MJO) and the second signal is coming from the highest part of the atmosphere over the North Pole.
Madden Julian Oscillation (MJO) The MJO is a tropical disturbance that propagates eastward around the global tropics with a cycle on the order of 30-60 days. It is a large-scale coupling between atmospheric circulation and tropical deep convection. The MJO has wide ranging impacts on the patterns of tropical and extratropical precipitation, atmospheric circulation, and surface temperature around the global tropics and subtropics. Furthermore, the MJO influences both precipitation and surface temperature patterns across the US. Specifically, one significant impact of the MJO in the U.S. during the northern hemisphere winter is an increase in the frequency and intensity of cold air outbreaks across the central and eastern US.
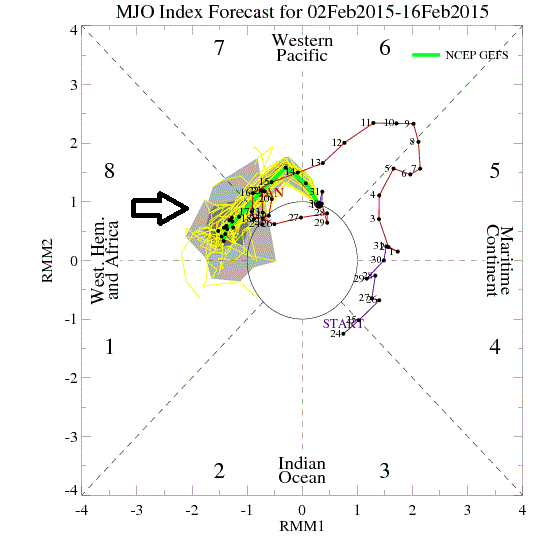
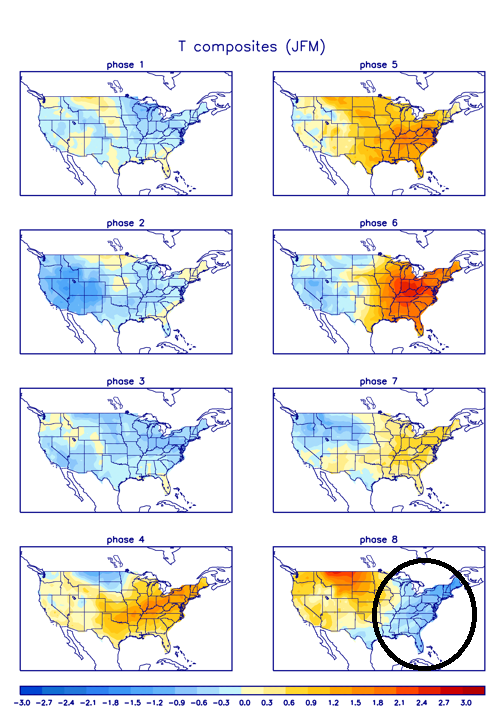
MJO Phases Research has found that the location of the MJO, or phase, is linked with certain temperature and precipitation patterns around the world. The MJO phase diagram (above) illustrates the recent and forecasted progression of the MJO index through different phases which generally coincide with locations along the equator around the globe. When the index is within the center circle, the MJO is considered weak, meaning it is difficult to discern. Outside of this circle, the index is stronger and will usually move in a counter-clockwise direction as the MJO moves from west to east. The very latest NOAA GFS Ensemble model forecast of the MJO index propagates it from its current "phase 6" location into "phase 8" as we progress towards mid-February (follow green line in figure above in a counter-clockwise fashion). Phase 8 for the MJO index this time of year (January/February/March) typically signals colder-than-normal temperatures in the eastern U.S. (see circled area below in "phase 8" temperature anomaly chart).
Sudden Stratospheric Warming (SSW) Another way to monitor the potential for Arctic air outbreaks in the northeastern U.S. is to follow what is happening in the stratosphere over the polar region of the northern hemisphere. Sudden stratospheric warming (SSW) events in the region of the North Pole have been found to set off a chain of events in the atmosphere that ultimately lead to Arctic air outbreaks from central Canada into the northeastern U.S. Indeed, there appears to be a significant stratospheric warming event in progress right now over the North Pole that could continue our colder-than-normal temperature pattern in the northeastern U.S. as we progress through the month of February and perhaps even into the month of March. The current stratospheric temperature pattern and the 5-day forecast are shown below and they show stratospheric warming at the North Pole during the next five days as the typical "polar-based" cold vortex is displaced towards Asia.
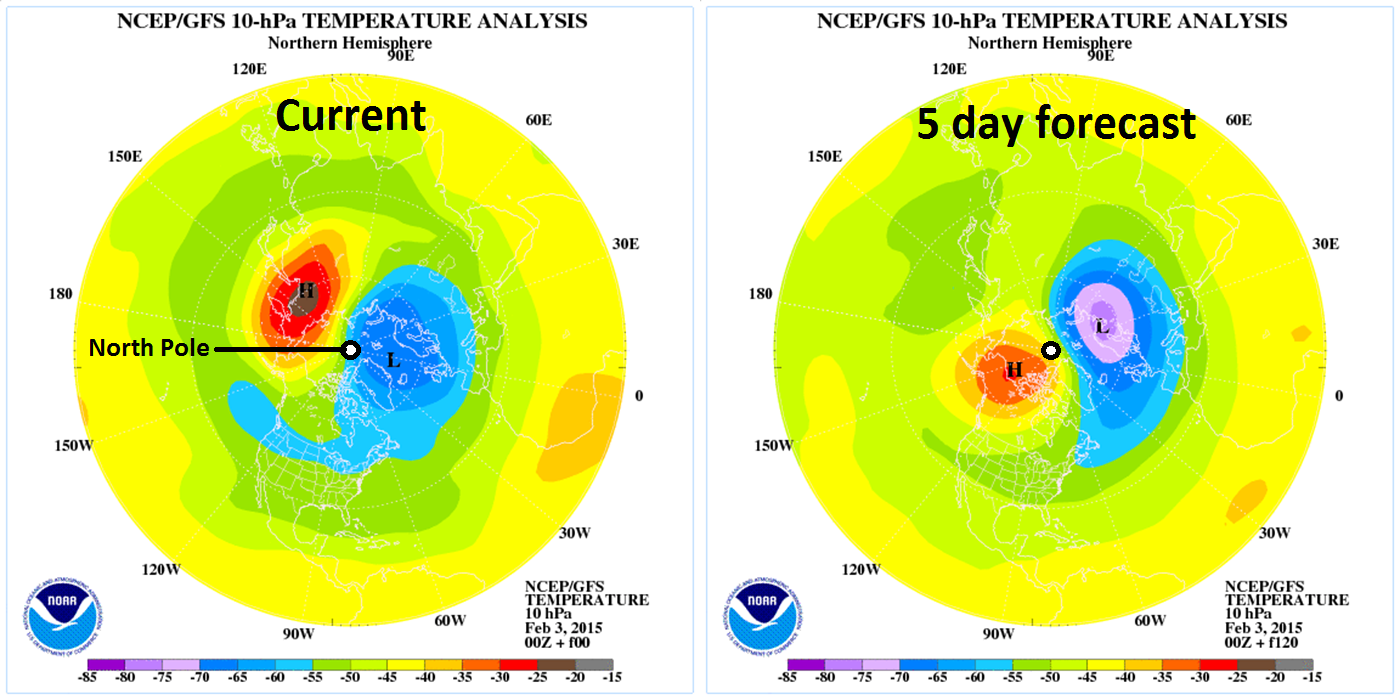
SSW Consequences During the winter months in the lower polar stratosphere, temperatures on average are below minus 70 degrees Celsius. The cold temperatures are combined with strong westerly winds that form the southern boundary of the stratospheric polar vortex. The polar vortex plays a major role in determining how much Arctic air spills southward toward the mid-latitudes. This dominant structure is sometimes disrupted in some winters or even reversed. Under these circumstances, the temperatures in the lower stratosphere can rise by more than 50 degrees in just a few days. This sets off a reversal in the west-to-east winds and the collapse of the polar vortex. In recent SSW events, the polar vortex has split into two pieces and that opened the floodgates for Arctic air to move southward. In response to the stratospheric warming at the high latitudes, the troposphere in turn cools down dramatically and this cold air displacement is then transported from the tropospheric high latitudes to the tropospheric middle latitudes. This doesn’t mean that each and every day following an SSW event will be below normal as that will not be the case. However, it does suggest that, based on historical similarities, we could be looking at an overall below-normal temperature pattern in the northeastern U.S. through February and perhaps even well into March.
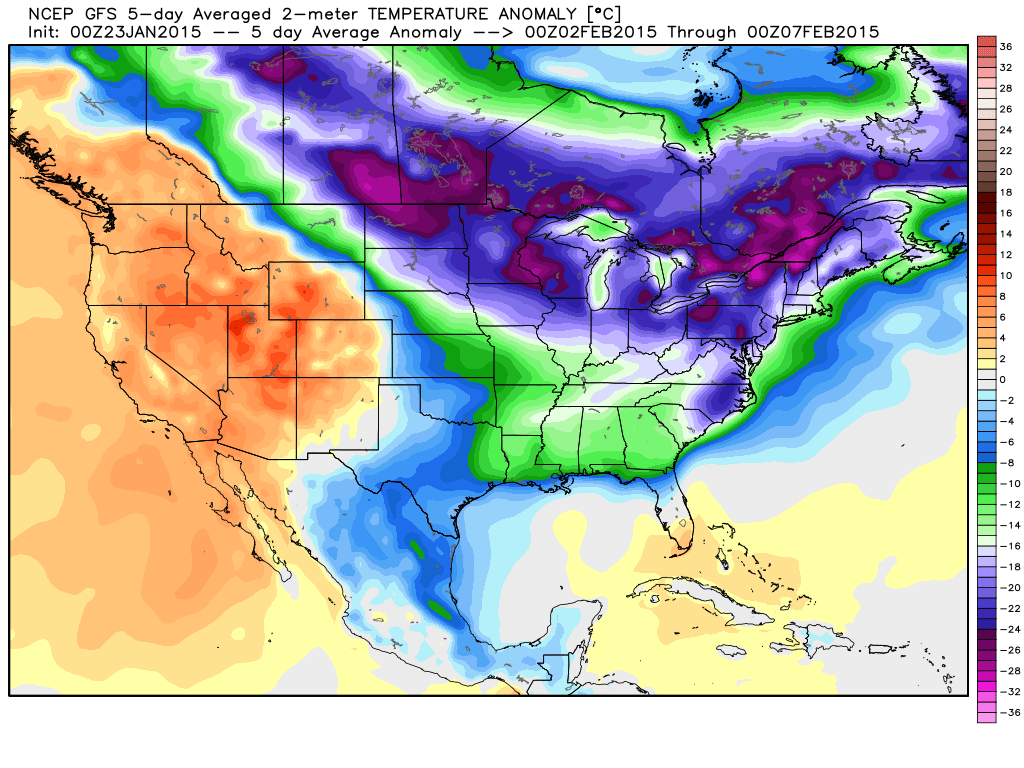 [GFS 2-meter temperature anomaly forecast map for 5-day period of 2/2-2/7; map courtesy Weather Bell Analytics at weatherbell.com]
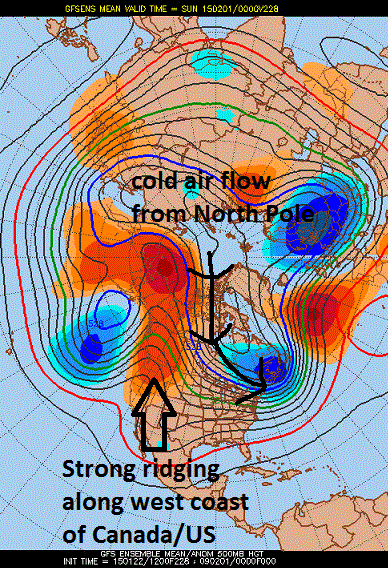 [GFS Ensemble height anomaly forecast map for February 1st; courtesy Penn State eWall]
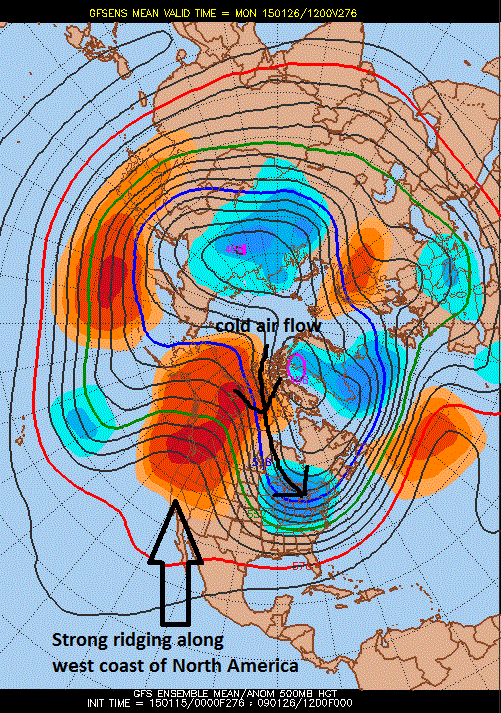 [00Z GFS Ensemble forecast map of 500 millibar height anomalies late this month; map courtesy Penn State eWall]
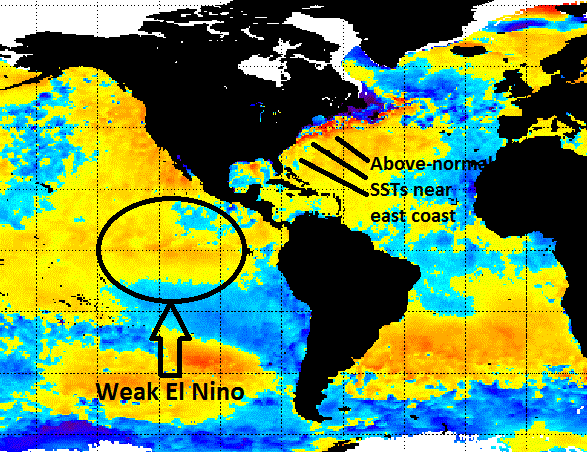 [Current sea surface temperature anomaly chart; courtesy NOAA]
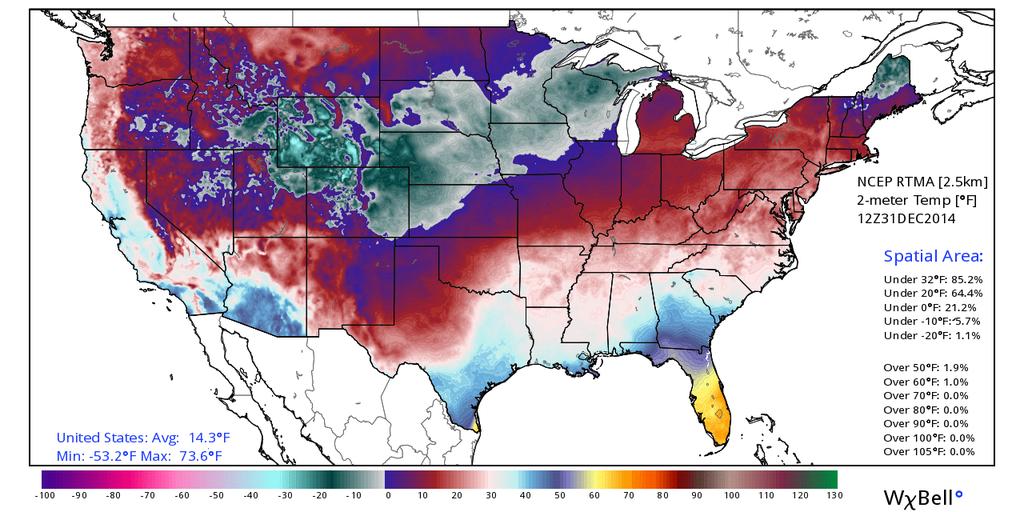 [7AM temperature map across the nation with average CONUS temperature of 14.3°F; map and data courtesy Ryan Maue of Weather Bell Analytics at "weatherbell.com"]
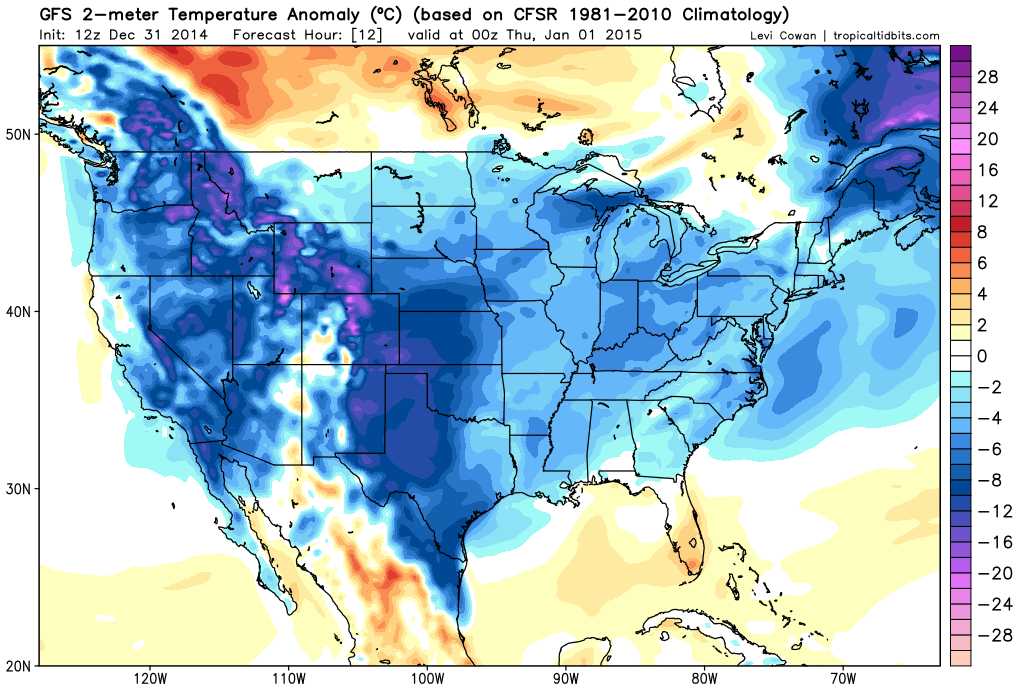 [12Z GFS 2-meter temperature anomaly forecast map for early tonight; map courtesy "tropicaltidbits.com"]
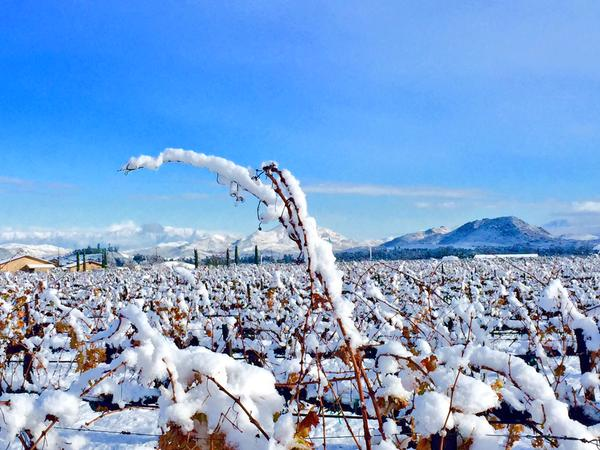 [Southern California (Temecula) vineyard in the deep freeze this morning]
 [Yellow line represents southern hemisphere sea ice areal extent throughout 2014; courtesy University of Illinois "cryosphere"; NOAA/NCEP]
 [red line represents global sea ice areal extent relative-to-normal (zero line); courtesy University of Illinois "cryosphere"; NOAA/NCEP]
 [Yellow line represents northern hemisphere sea ice areal extent throughout 2014; courtesy University of Illinois "cryosphere"; NOAA/NCEP]
 [Polar view of current stratospheric (10-millibars) temperature pattern and the 10-day forecast using the GFS model; courtesy NOAA]
 [Stratospheric (10-millibars) temperature plot for 2013 and 2014 in high latitude region of 90N to 65N; courtesy NOAA]
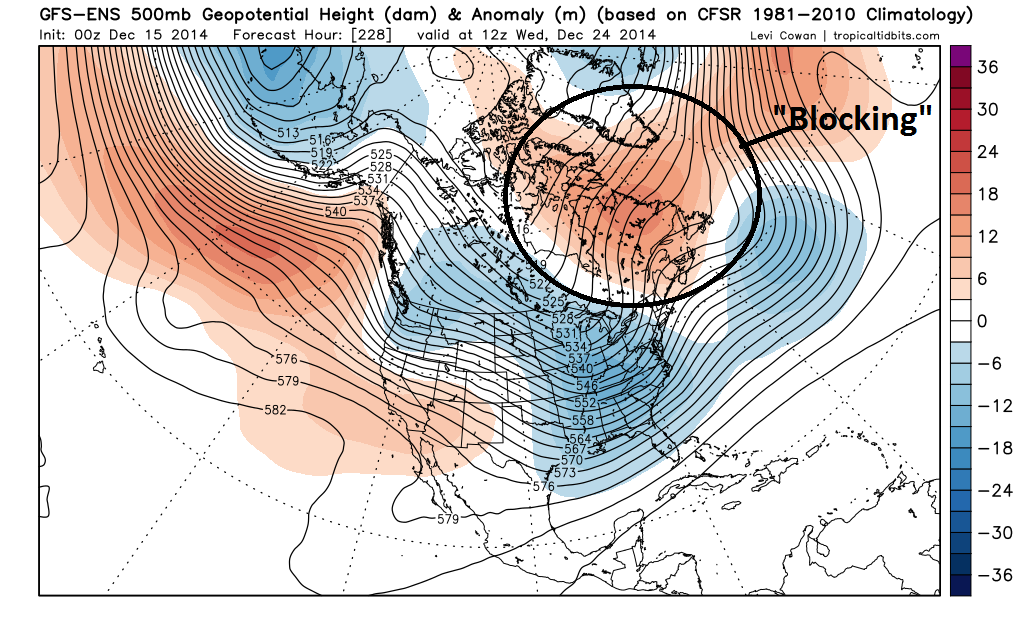 [00Z GFS-Ensemble 500 mb height anomaly forecast for Christmas Eve (12/24); map courtesy "tropicaltidbits.com"]
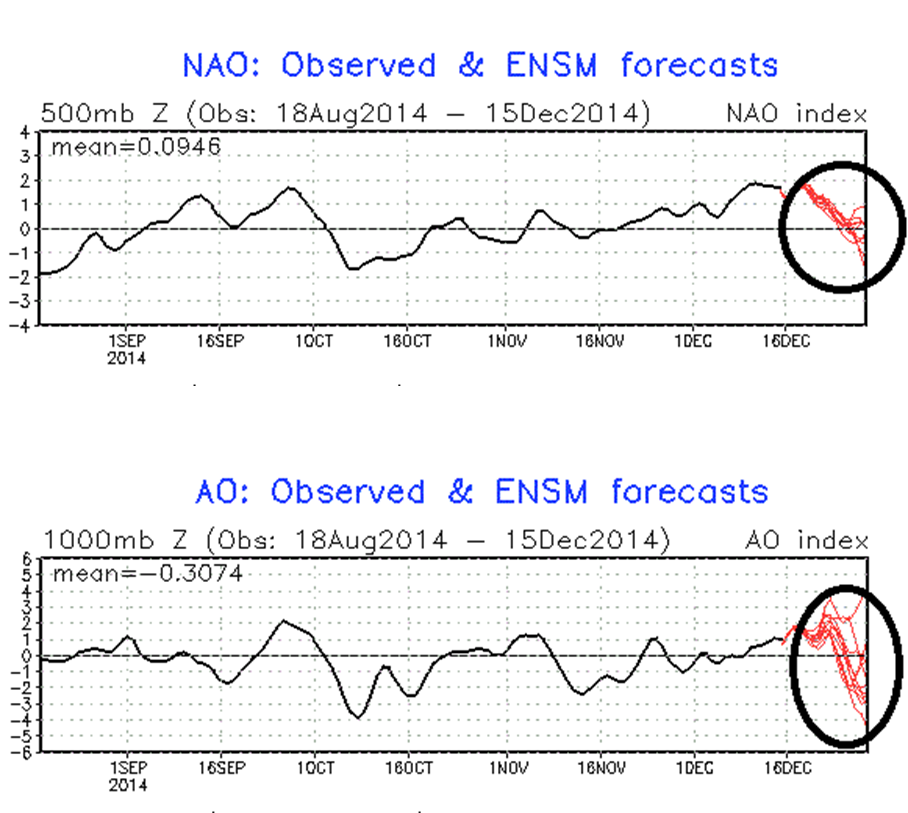 [North Atlantic Oscillation index and Arctic Oscillation index forecasts; courtesy NOAA]
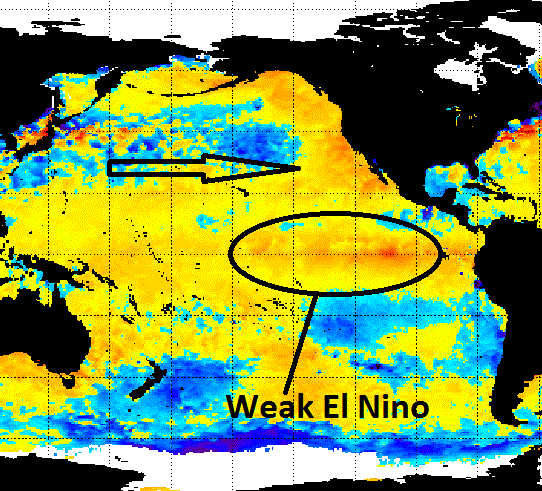 [Current sea surface temperature anomalies; courtesy NOAA]
 [12Z GFS-ENS Christmas Day forecast for 500 mb height anomalies with an upper level trough in the eastern US and impressive blocking high pressure in eastern Canada; map courtesy tropicaltidbits.com]
 [Probabilities for a white Christmas across the US; courtesy NOAA]
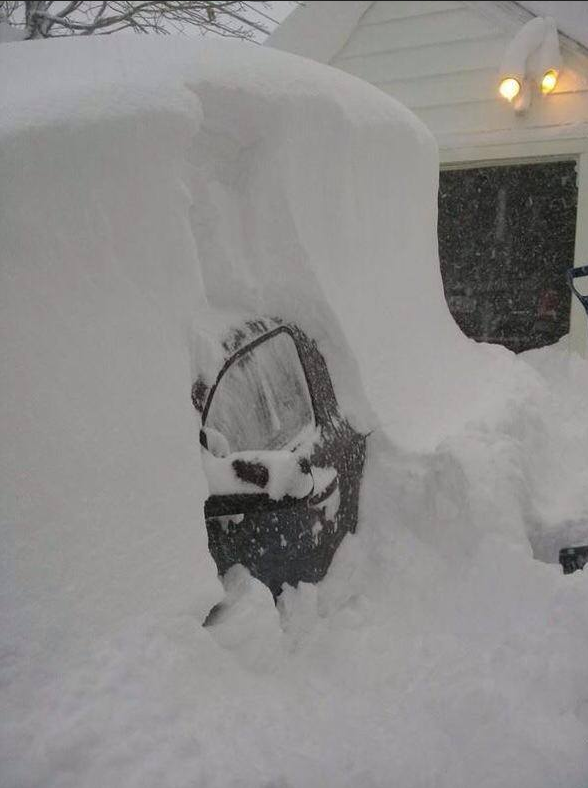 [Buffalo snow as of this morning]
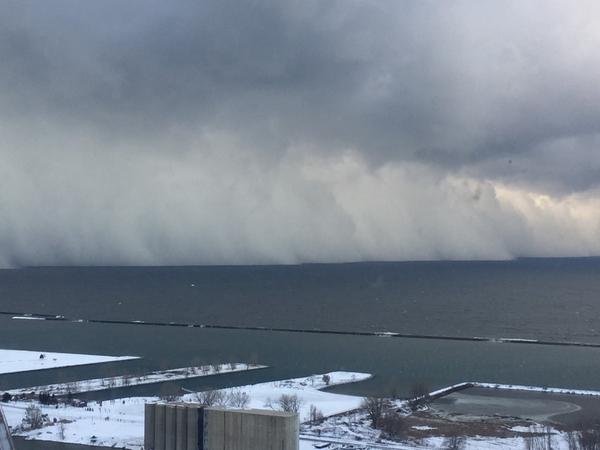 [Looking south over Lake Erie with walls of snow headed towards Buffalo]
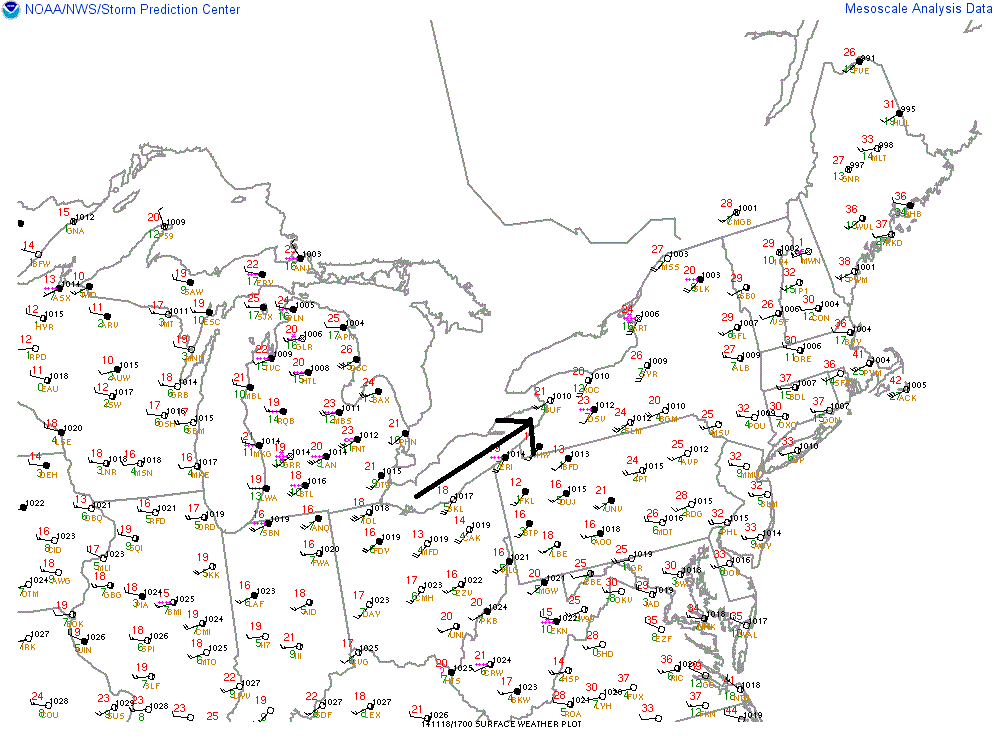 [Surface map showing southwest winds over Lake Erie which is perfect setup for Buffalo; courtesy NOAA]
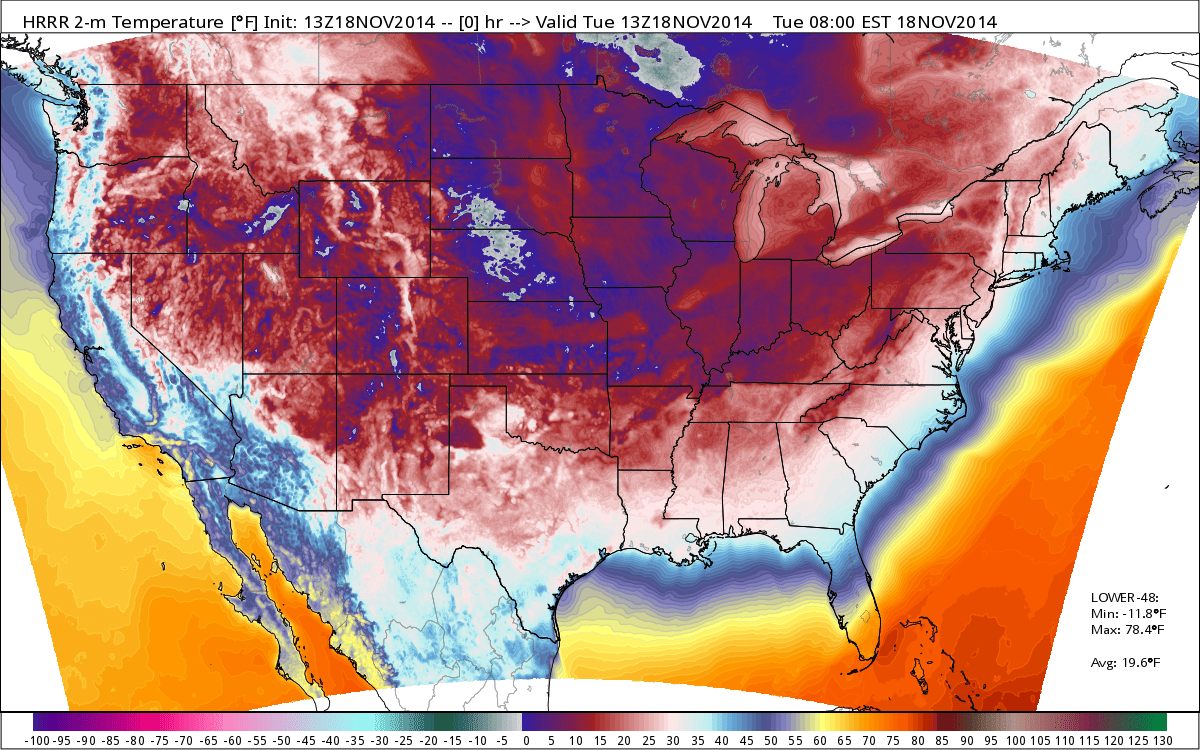 [Coldest November day across the nation since 1976; map and data courtesy Weather Bell Analytics]