Contact Us

Use the form on the right to contact us.

You can edit the text in this area, and change where the contact form on the right submits to, by entering edit mode using the modes on the bottom right. 


123 Street Avenue, City Town, 99999

(123) 555-6789

email@address.com


You can set your address, phone number, email and site description in the settings tab.
Link to read me page with more information.

backlit-stratus-clouds-2013-04-05.jpg

Blog

Weather forecasting and analysis, space and historic events, climate information

Filtering by Category: Climate Info

2:45 PM | Pattern change continues to look likely in the eastern US by New Year’s Day, but two more record-breaking warm surges in the near term

Paul Dorian

The month of December has been much warmer-than-normal in the Mid-Atlantic region and there are at least two more widespread record-breaking days to come in the near future.  Longer term, however, there are signals for an important pattern change in the eastern states as we begin the New Year.  One of the signals for a pattern change is connected to a tropical disturbance called the Madden Julian Oscillation (MJO).  Its projected changes over the next couple of weeks as depicted by a reliable computer forecast model (Euro) suggest changes are coming here by the beginning of January.     

Read More

1:45 PM | Pattern change likely to take place around New Year's Day

Paul Dorian

The month of December has been much warmer-than-normal in the Mid-Atlantic region and there are several warm days still to come during this week and next.  Indeed the month of December could turn out to be the warmest ever in much of the region aided in large part by the strong El Nino oceanic cycle in the tropical Pacific Ocean.  So far this month temperatures have averaged 10.6°F above normal in Philadelphia, 11.3°F above normal in Central Park, NY, and 7.6°F above normal in Washington, D.C (Reagan National Airport).  There are signs; however, for an important change in the overall weather pattern that is likely to occur around the New Year’s Day holiday period and it should bring quite a change in temperatures to the eastern states from well above normal to much closer-to-normal.   

Read More

1:00 PM | Stratospheric warming event may signal colder pattern ahead

Paul Dorian

Polar view of current stratospheric (10-millibars) temperature pattern and the 9-day forecast using the 00Z GFS computer forecast model; courtesy NOAA

Polar view of current stratospheric (10-millibars) temperature pattern and the 9-day forecast using the 00Z GFS computer forecast model; courtesy NOAA

Overview

One of the ways to monitor the potential for Arctic air outbreaks in the northern U.S. is to follow what is happening in the stratosphere over the polar region of the northern hemisphere. Sudden stratospheric warming (SSW) events are large, rapid temperature rises in the winter polar stratosphere occurring primarily in the Northern Hemisphere.  They have been found to often set off a chain of events in the atmosphere that ultimately leads to Arctic air outbreaks from northern Canada into the central and eastern U.S. Indeed, there appears to be a stratospheric warming event in the offing over the next week to ten days (above) centered near the North Pole that provides some reason to believe that the current warm temperature pattern in the eastern US could change during the month of January.   

Stratospheric warming

During the winter months in the lower polar stratosphere, temperatures are typically lower than minus 70° Celsius (purple area above). The cold temperatures are combined with strong westerly winds that form the southern boundary of the stratospheric polar vortex. The polar vortex plays a major role in determining how much Arctic air spills southward toward the mid-latitudes. This dominant structure is sometimes disrupted in some winters or even reversed. Under these circumstances, the temperatures in the lower stratosphere can rise by more than 50°K in just a few days. This sets off a reversal in the west-to-east winds and the collapse of the polar vortex. In response to the stratospheric warming at the high latitudes, the troposphere in turn cools down dramatically and this cold air displacement is then transported from the tropospheric high latitudes to the tropospheric middle latitudes. The entire process from the initial warming of the stratospheric at high latitudes to the cooling in the troposphere at middle latitudes can take weeks to unfold.

Comparison to last year’s stratospheric temperatures

The plot (below) shows the stratospheric (10-millibar) temperature pattern for 2014 and 2015 in the high latitude region of 90°N to 65°N. Interestingly, last winter season featured a sharp spike in stratospheric temperatures at just about this same time of year (i.e., mid-to-late December as indicated by the arrow below) and the following couple of months were indeed quite cold in the central and eastern US.  Some stratospheric warming events in recent decades have, in fact, been followed by widespread very cold air outbreaks across southern Canada and the US some two to three weeks after the initial upper atmosphere warming. For example, such an event occurred during December 1984 and this led to an extremely cold January 1985 in much of the central and eastern US. A detailed video discussion on “Stratospheric Warming” can be found on the “Meteorology 101” page of the Vencore weather web site.  We’ll continue to closely monitor temperature changes in the stratosphere over the North Pole during the next few weeks to see how this warming event unfolds. 

Stratospheric (10-millibars) temperature plot for 2014 and 2015 in high latitude region of 90°N to 65°N; courtesy NOAA Meteorologist Paul DorianVencore, Inc.

Stratospheric (10-millibars) temperature plot for 2014 and 2015 in high latitude region of 90°N to 65°N; courtesy NOAA


Meteorologist Paul Dorian

Vencore, Inc.

8:45 AM | Major chill down this weekend...major warm up next week

Paul Dorian

Despite an upcoming cold weekend, our recent warm weather pattern will re-emerge next week and it’ll likely continue right past Christmas Day.  The month of December so far has been well above normal in the Mid-Atlantic region (+10.8 at PHL, +8.1 at DCA, +11.2 at Central Park) and there will be a setback this weekend, but the eastern US will warm up significantly next week while the western states cool down dramatically.  In fact, record warmth is likely in many areas east of the Mississippi River by the middle of next week.

Read More

9:30 AM | Global sea ice fights its way back to near normal after sharp drop earlier this year

Paul Dorian

Overview

Strong El Nino conditions continue to exist in the tropical Pacific Ocean as we approach the end of 2015 and this natural oceanic phenomenon ranks as one of the three strongest during the past 50 years.  In fact, this El Nino (warmer-than-normal sea surface temperatures) is likely near its peak intensity level and it has already had major ramifications around the world.  For example, global temperatures have spiked to well above-normal levels and this temperature pattern is likely to continue well into 2016.  By late 2016, however, it is looking more and more likely that El Nino will completely reverse into La Nina (colder-than-normal) conditions and – if history is any guide - global temperatures are then likely to drop sharply. 

In addition to its impact on global temperatures, the on-going strong El Nino event in the tropical Pacific Ocean has no doubt played some role in the sharp drop of global sea ice extent in recent months despite the fact that it is far removed from the polar regions.  However, as we approach the end of the year - and despite the continuing strong El Nino event - global sea ice has actually fought its way back to near-normal levels – much as it was during the past couple of years.

red line represents global sea ice areal extent compared to the 1979-2008 normal as represented by the “zero” line; data courtesy University of Illinois "cryosphere"; NOAA/NCEP Snow and Ice Data Center

red line represents global sea ice areal extent compared to the 1979-2008 normal as represented by the “zero” line; data courtesy University of Illinois "cryosphere"; NOAA/NCEP Snow and Ice Data Center

Southern Hemisphere

After soaring to near record high levels during the past couple of years, sea ice in the Southern Hemisphere dropped sharply recently in areal extent from way above-normal amounts to below-normal levels.  That drop to below-normal, however, has not lasted too long.  In the past several weeks, sea ice has actually increased in areas surrounding the continent of Antarctica relative-to-normal and it is now once again running at above-normal levels (plot below), but not nearly as high as it was about one year ago.  Southern hemisphere sea ice recently stayed above-normal for a period of more than three years, from 2012 to 2015. This is something that had never happened before during the satellite period dating back to 1979. 

Southern Hemisphere sea ice anomaly since 1979; data courtesy University of Illinois “cryosphere”

Southern Hemisphere sea ice anomaly since 1979; data courtesy University of Illinois “cryosphere”

Northern Hemisphere

The northern hemisphere sea ice areal extent is still below-normal relative to all years going back to 1979 although it is well above the lowest point set during 2012 - and even above levels seen earlier this year. The northern hemisphere sea ice areal extent is currently 742,000 square kilometers below the mean using the base period of 1979-2008 for comparison (plot below). The northern hemisphere sea ice areal extent has leveled off in the past 10 years or so at below-normal levels after dropping consistently from the mid 1990’s to the middle of the last decade. In the time period before the mid 1990’s, the sea ice areal extent was generally above-normal dating back to 1979. 

Northern Hemisphere sea ice anomaly since 1979; data courtesy University of Illinois “cryosphere”


The directional shift in the sea ice areal extent trendline that developed during the mid-1990’s in the northern hemisphere correlates quite well with a northern Atlantic Ocean sea surface temperature cycle that is tracked by meteorologists through an index called the Atlantic Multidecadal Oscillation (AMO). Indeed, Atlantic Ocean sea surface temperature anomalies play a critical role in the overall northern hemisphere sea ice areal extent. The AMO index flipped in phase during the mid-1990’s from negative (cold) to positive (warm) and the sea ice areal extent trendline changed direction right around that point in time.

The Atlantic Ocean is just recently showing signs of a long-term temperature phase shift back to cold and if that trend continues over the next couple of years then the northern hemisphere sea ice areal extent is quite likely to return to the same above-normal levels that were seen prior to the mid 1990’s. (Click here for more information on the potential significant long-term temperature phase shift in the Atlantic Ocean: http://vencoreweather.com/2015/03/22/1230-pm-the-atlantic-ocean-is-showing-signs-of-a-possible-significant-long-term-shift-in-temperatures-from-warm-to-cold/). 

In fact, the northern hemisphere sea ice has actually shown great resiliency in recent years and has rebounded to the highest levels seen during the past ten years according to recent data from the Danish Meteorological Institute (plot below, http://ocean.dmi.dk/arctic/old_icecover.uk.php ).

Northern hemisphere sea ice extent for 2015 (black line); Note - the sea ice extent here is calculated with the coastal zones masked out.

Northern hemisphere sea ice extent for 2015 (black line); Note - the sea ice extent here is calculated with the coastal zones masked out.


Meteorologist Paul Dorian

Vencore, Inc.

11:00 AM | Signs for colder weather as we progress through second half of December

Paul Dorian

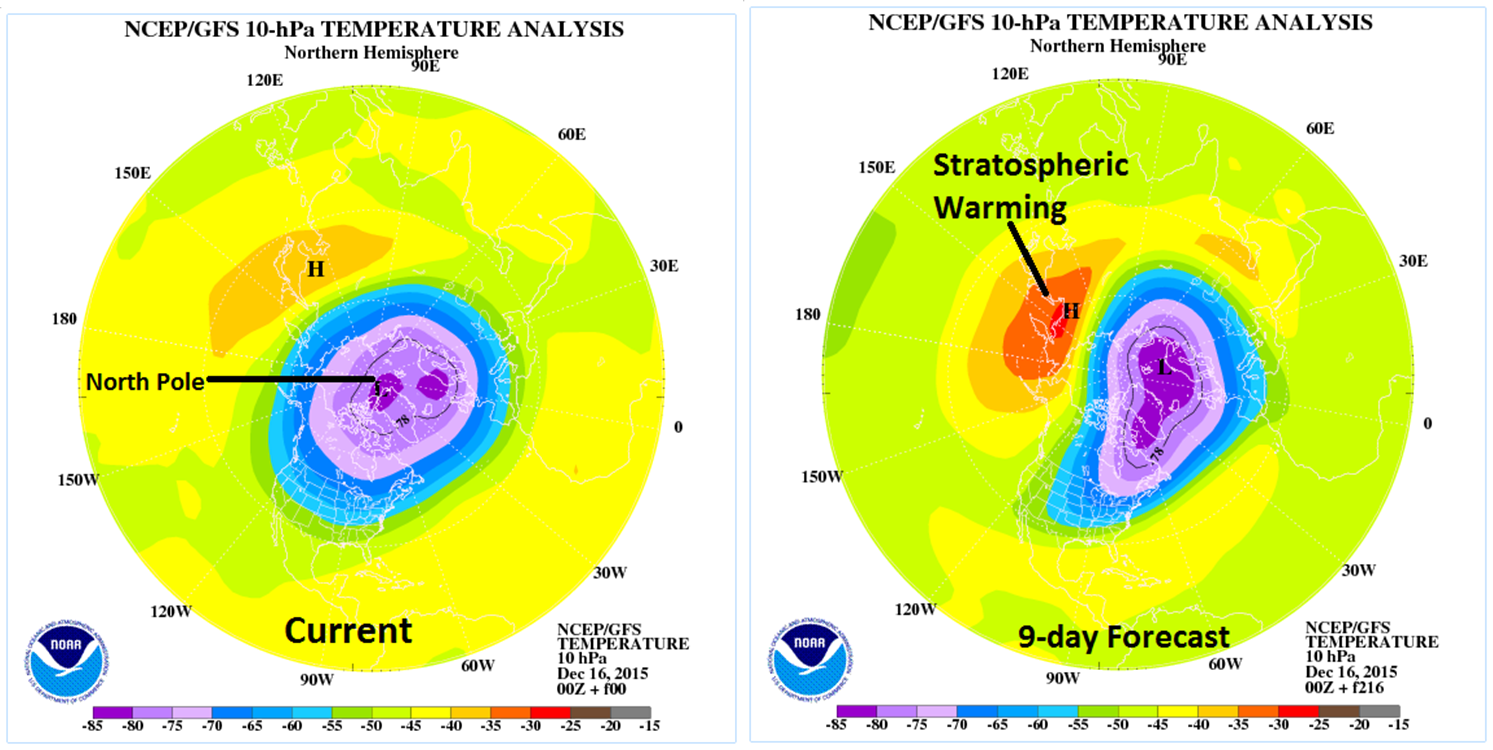
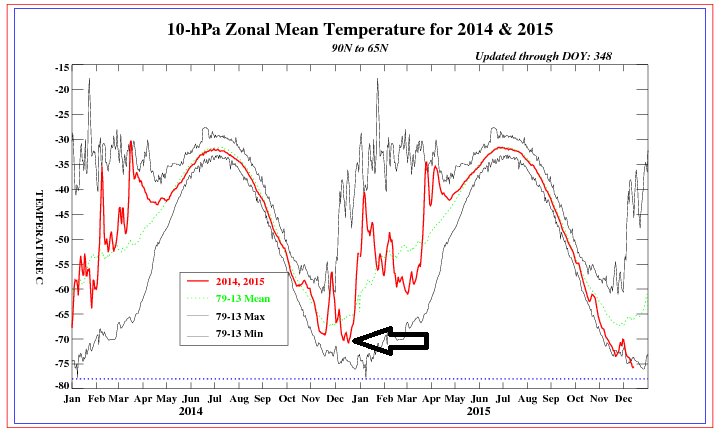
The first week of December was quite mild in the I-95 corridor with temperatures averaging 6.5 degrees above normal in Philadelphia, 6.2 degrees above normal at Central Park in New York and 3.1 degrees above normal at Reagan National Airport in Washington, D.C.  This week also looks relatively mild with high temperatures likely reaching or even exceeding the 60 degree mark in parts of the region by this weekend.  Looking ahead, however, there are signs that the upper atmosphere pattern will change to allow for more normal cold to arrive as we progress through the second half of December.

Read More

3:00 PM | Mount Etna erupts and lights up the skies in Sicily, Italy

Paul Dorian

Mount Etna is the largest volcano in Europe and one of the most active volcanoes in the world.  On Thursday morning, December 3rd, southern Italy woke up to see an eruption after two years of silence.  Scientists say it was the most violent eruption from the volcano in the past two decades.  The intense eruption exploded from Etna’s Voragine crater with ash reaching as high as 10,000 feet into the atmosphere and a fountain of lava as high as 5000 feet.  High level winds pushed ash over villages in Sicily and other portions of southern Italy.  Volcanic lightning was also seen above Mt Etna on Thursday during the eruption period which lasted less than an hour.  The Voragine crater was formed inside of the central crater in 1945 and is among three other craters in the volcano: Bocca Nuova, the crater of the Northeast, and the crater of the Southeast which is said to be the most active one.  

Read More

9:00 AM | Another down year in the US for hurricanes and tornadoes

Vencore Weather

More good news this year for the nation on the extreme weather front as it has been another down year in terms of hurricanes and tornadoes. The Atlantic Basin hurricane season officially ends tomorrow, December 1st, and it is quite likely safe to say that this will be another below-normal year in the US for land falling tropical storm activity. In fact, the US has not been struck by a major hurricane (category 3, 4 or 5) in slightly more than ten years and this is the longest drought of that kind since record-keeping began in 1851. In addition, 2015 is turning out to be another below-normal year for tornadoes across the nation and this too continues a trend that is a decade in the making.

Read More

12:40 PM | *Soaking rain event on Thursday to be followed by cold blast for the weekend…coldest weather so far for Sunday and Monday...looking ahead to Turkey Day*

Paul Dorian

storm.png

[Today's satellite image of major storm that is headed into the eastern US; courtesy NASA, Capital Weather Gang]

Discussion

Thursday rain event

A powerful storm system that currently extends from Mexico to Canada is headed towards the eastern US and it will produce a significant rain event for much of the region on Thursday (satellite image above). This is the same storm system that produced heavy snow and winter cold in Colorado and Kansas earlier in the week as well as tornadoes in its warm sector across parts of the central US. The rain is likely to arrive here late tonight and continue through the morning and it could very well have a negative impact on the morning commute in DC, Philly and perhaps even New York City (could hold off there until just afterward rush hour). The winds will be quite gusty tomorrow ahead of a strong cold front and there can be an isolated thunderstorm or two during this upcoming event.

sun_am_fcst_map.png

[12Z GFS surface forecast map for Sunday morning (blues=snow); courtesy NOAA, tropicaltidbits.com]

Progressively colder Friday, Saturday and Sunday

This significant rain event will be followed by a colder air mass in the Mid-Atlantic region to close out the work week on Friday, but this will be just the first "step-down" in temperatures in coming days. Another storm system will move quickly from the Rockies this weekend and head towards the Great Lakes region likely producing the first accumulating snow of the season in places like Chicago, Detroit and Madison. This next storm will slide a secondary cold front through here on Saturday night and the coldest air mass of the season will arrive on Sunday. In fact, Sunday promises to be the coldest day of the season so far and snow flurries/snow showers are not out of the question across portions of the Mid-Atlantic and Northeast US (forecast surface map above; blue=snow). Well-below normal temperatures will remain stuck in place across the eastern US on Monday as we begin the new work week (temperature anomaly forecast map below).

mon_am_temps.png

[12Z GFS temperature anomaly forecast map for Monday morning; courtesy NOAA, tropicaltidbits.com]

Looking ahead to Turkey Day and beyond

While still chilly next Tuesday, it is likely that the second half of next week will see a turn to milder conditions in the eastern US following this weekend’s cold blast and before another cold blast arrives late in the weekend following Thanksgiving Day. This next cold blast which will arrive near the end of November is likely to be even colder than this weekend’s outbreak.

10:00 AM | Heavy rain event on Thursday triggers pattern change to noticeably colder

Paul Dorian

days1-5.png

[00Z GFS Ensemble 2-meter temperature anomaly forecast map for days 1-5; courtesy NOAA, "tropicaltidbits.com"]

Discussion

Near term

So far the month of November has been well above normal in the Mid-Atlantic region (Philly +7.1°, DCA +5.0°, NYC +6.4°), but it looks like the overall mild pattern is going to change noticeably to colder for the last ten days of the month and perhaps right even into early December and all of this is going to be triggered by a heavy rain event on Thursday. After a mild day to start the work week, there will be a temporary setback in the mild temperatures on Tuesday as a back door cold front slides southward through the Mid-Atlantic region during the overnight hours. High temperatures on Tuesday afternoon will be some ten degrees cooler than what is expected later this afternoon. Milder air pushes northward again on Wednesday and Thursday riding in on increasingly strong south-to-southwest winds and a strong cold front will be approaching from the west. Heavy rain is likely from the cold frontal system late Wednesday night and Thursday in the I-95 corridor and this event will trigger the temperature pattern change to colder beginning by this upcoming weekend.

days6-10.png

[00Z GFS Ensemble 2-meter temperature anomaly forecast map for days 6-10; courtesy NOAA, "tropicaltidbits.com"]

Longer term

Last night’s GFS Ensemble run at 00Z shows nicely the changes that are coming not only here to the Mid-Atlantic region for the last ten days of the month, but also to much of the nation as well. The first map (top) shows the overall temperature anomalies across the US for days 1-5 (16NOV-21NOV). Warmer-than-normal conditions (oranges) dominate in the eastern US with mainly colder-than-normal (blues) weather out west during this current 5-day stretch. Beyond that, the 6-10 day (21NOV-26NOV) temperature anomaly forecast map (middle) shows big changes in the Mid-Atlantic region with colder-than-normal (blues) conditions and it is similarly cold throughout most of the nation away from the southwestern states. Does the cold hold beyond that time period? The 11-15 day (26NOV-01Dec) temperature anomaly forecast map (bottom) indicates it certainly will with colder-than-normal weather continuing in most of the nation right from Thanksgiving into the beginning of December. As far as snow is concerned, there are signs for some threats in the Northeast US in the weekend after Thanksgiving or the early part of December and we’ll monitor those chances in the days ahead.

days11-15.png

[00Z GFS Ensemble 2-meter temperature anomaly forecast map for days 11-15; courtesy NOAA, "tropicaltidbits.com"]