
9:00 AM | NOAA upgrades its main global computer forecast model (GFS) and enhances its computing power
Paul Dorian
Discussion
Overview Effective 12Z Wednesday, January 14th, 2015, NOAA’s Environmental Modeling Center (EMC) began running an upgraded version of its main computer global forecast model called the Global Forecast System (GFS). The upgraded GFS model has greater horizontal resolution compared to its predecessor version and the higher resolution runs now extend farther out in time. In preparation for the upgraded computer forecast model, NOAA has recently upgraded its computing capability with each of its two supercomputers by more than tripling their capacity. Much of this effort of upgrading the computer forecast model and computing capability was accelerated after Hurricane Sandy struck the Northeast US in 2012 as the main NOAA forecast model produced some inferior results in its prediction of the storm track when compared to its equivalent European counterpart.
Global Forecast System (GFS) The upgraded GFS model now has increased horizontal resolution in the first segment of its forecast package from 27 to 13 km and this higher resolution now extends out to 10 days whereas previously the higher resolution only went out to 7.5 days. The second segment of the GFS forecast package has seen an increase in horizontal resolution from 55 to 35 km which extends out from 10 days to 16 days. Furthermore, the upgraded model has enhanced physics and a better handling of important parameters such as sea surface temperatures, sea ice concentration, and snow depth which are all utilized by the model.
Computing power Modern numerical weather prediction uses the world’s most powerful computers and the associated software includes millions of lines of code. Some of the biggest computers in the world are used for weather and climate simulations. NOAA has upgraded its computing capability with each of its two supercomputers by more than tripling their capacity to at least 0.776 petaflops for a total capacity of 1.552 petaflops (a petaflop is a thousand trillion operations per second). The amount of data collected for operational numerical weather prediction is mind boggling. Petabytes of weather data are streaming to earth from dozens of weather satellites each day. In addition, hundreds of thousands of surface stations, roughly a thousand radiosondes, thousands of ships and buoys, thousands of aircraft, lightning detection networks, and other sensors are reporting each day adding up to hundreds of terabytes of information. All of this data is distributed around the world, quality controlled, and used to provide a physically consistent description of the three-dimensional atmosphere (info here provided courtesy Cliff Mass, University of Washington). Additional computing capacity and forecast model upgrades are scheduled by NOAA during the next few years.
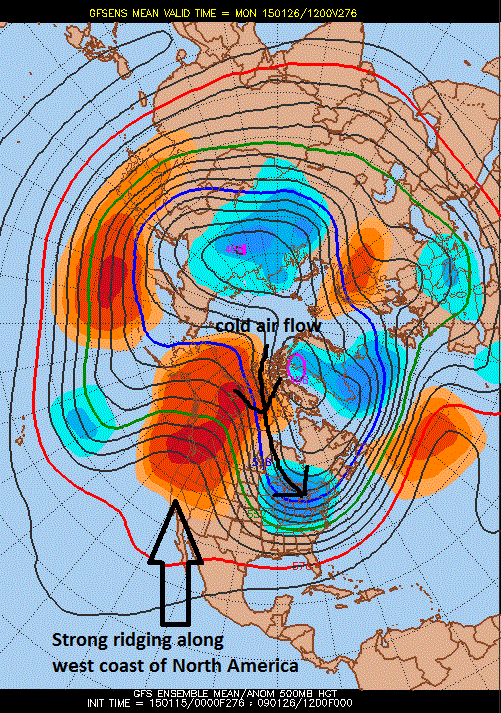 [00Z GFS Ensemble forecast map of 500 millibar height anomalies late this month; map courtesy Penn State eWall]
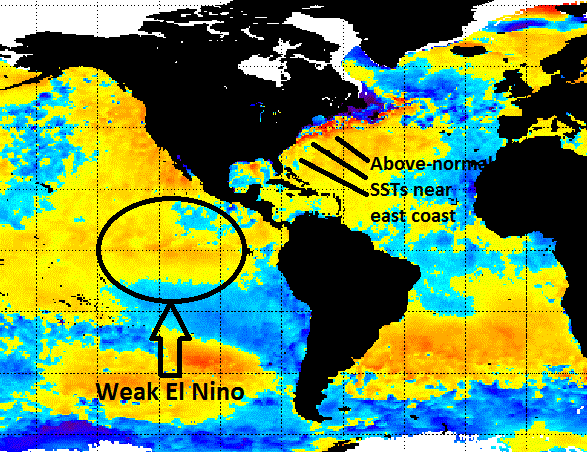 [Current sea surface temperature anomaly chart; courtesy NOAA]
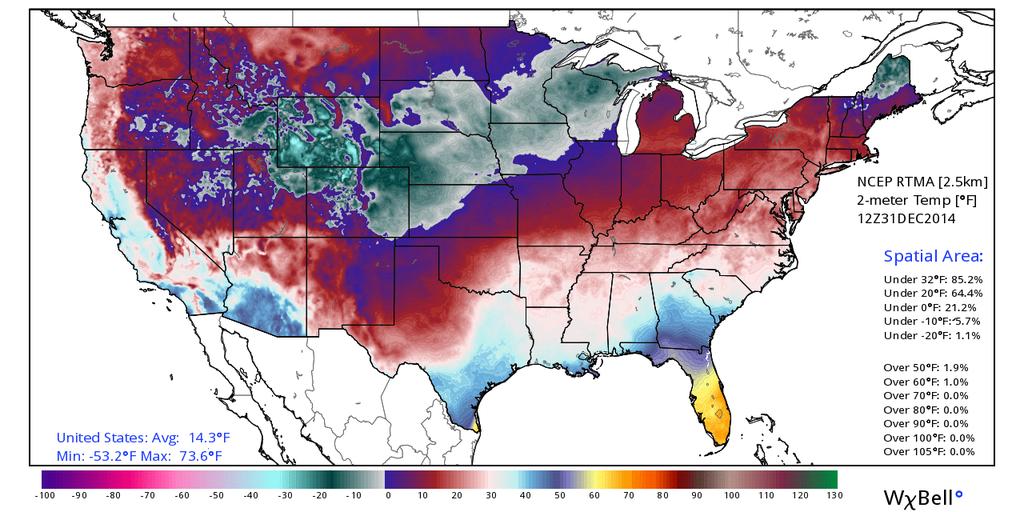 [7AM temperature map across the nation with average CONUS temperature of 14.3°F; map and data courtesy Ryan Maue of Weather Bell Analytics at "weatherbell.com"]
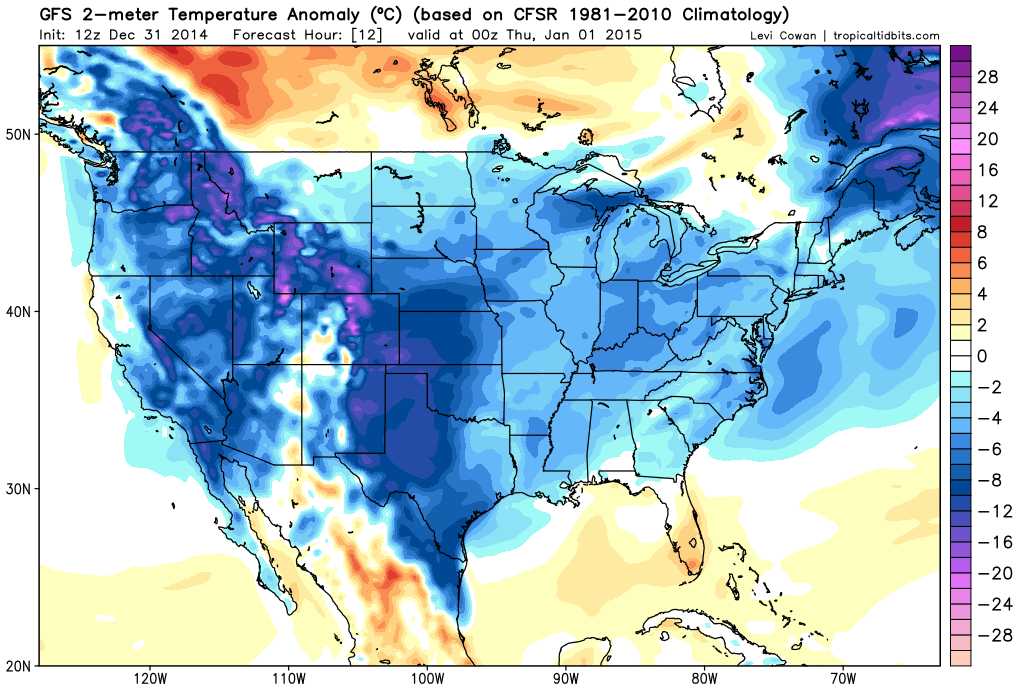 [12Z GFS 2-meter temperature anomaly forecast map for early tonight; map courtesy "tropicaltidbits.com"]
 [Southern California (Temecula) vineyard in the deep freeze this morning]
 [Yellow line represents southern hemisphere sea ice areal extent throughout 2014; courtesy University of Illinois "cryosphere"; NOAA/NCEP]
 [red line represents global sea ice areal extent relative-to-normal (zero line); courtesy University of Illinois "cryosphere"; NOAA/NCEP]
 [Yellow line represents northern hemisphere sea ice areal extent throughout 2014; courtesy University of Illinois "cryosphere"; NOAA/NCEP]
 [Polar view of current stratospheric (10-millibars) temperature pattern and the 10-day forecast using the GFS model; courtesy NOAA]
 [Stratospheric (10-millibars) temperature plot for 2013 and 2014 in high latitude region of 90N to 65N; courtesy NOAA]
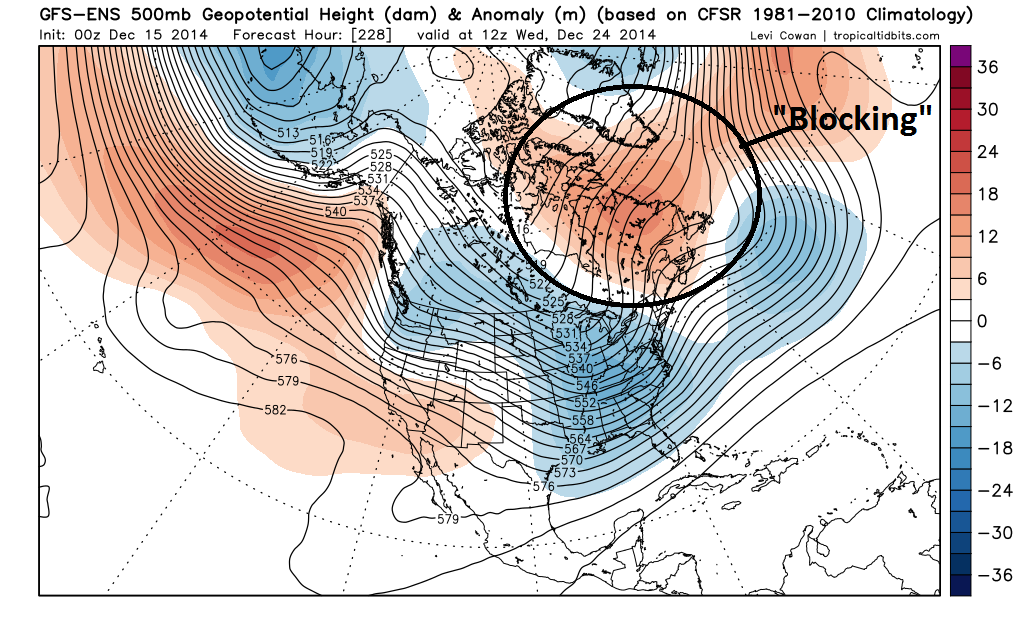 [00Z GFS-Ensemble 500 mb height anomaly forecast for Christmas Eve (12/24); map courtesy "tropicaltidbits.com"]
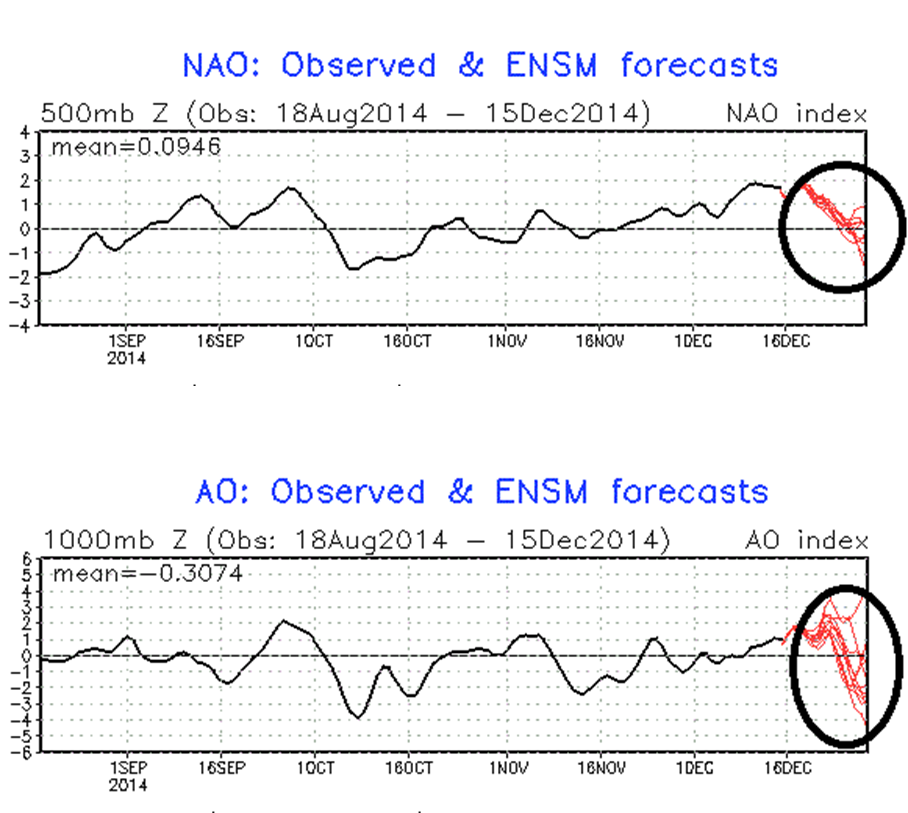 [North Atlantic Oscillation index and Arctic Oscillation index forecasts; courtesy NOAA]
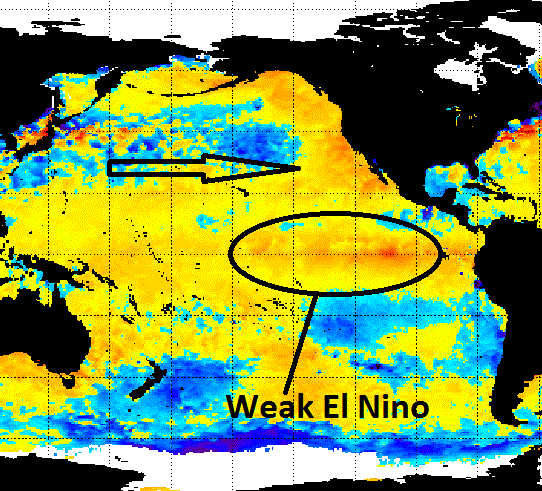 [Current sea surface temperature anomalies; courtesy NOAA]
 [12Z GFS-ENS Christmas Day forecast for 500 mb height anomalies with an upper level trough in the eastern US and impressive blocking high pressure in eastern Canada; map courtesy tropicaltidbits.com]
 [Probabilities for a white Christmas across the US; courtesy NOAA]
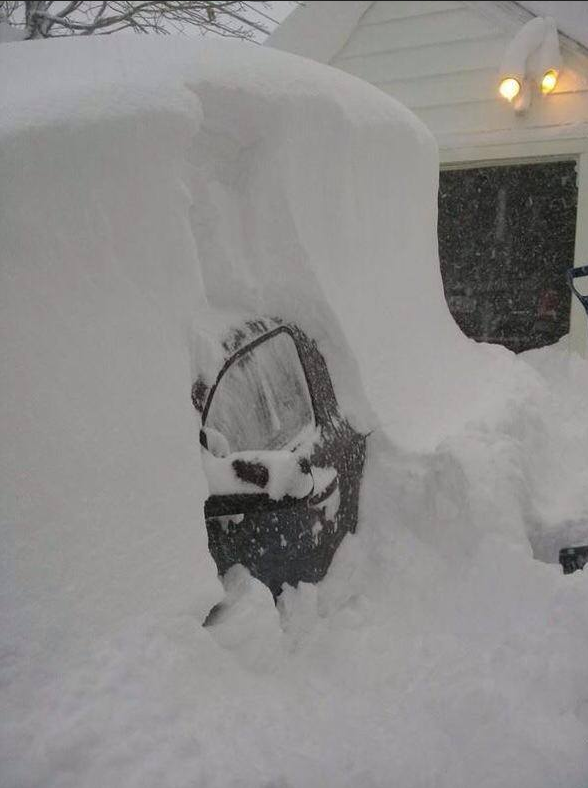 [Buffalo snow as of this morning]
 [Looking south over Lake Erie with walls of snow headed towards Buffalo]
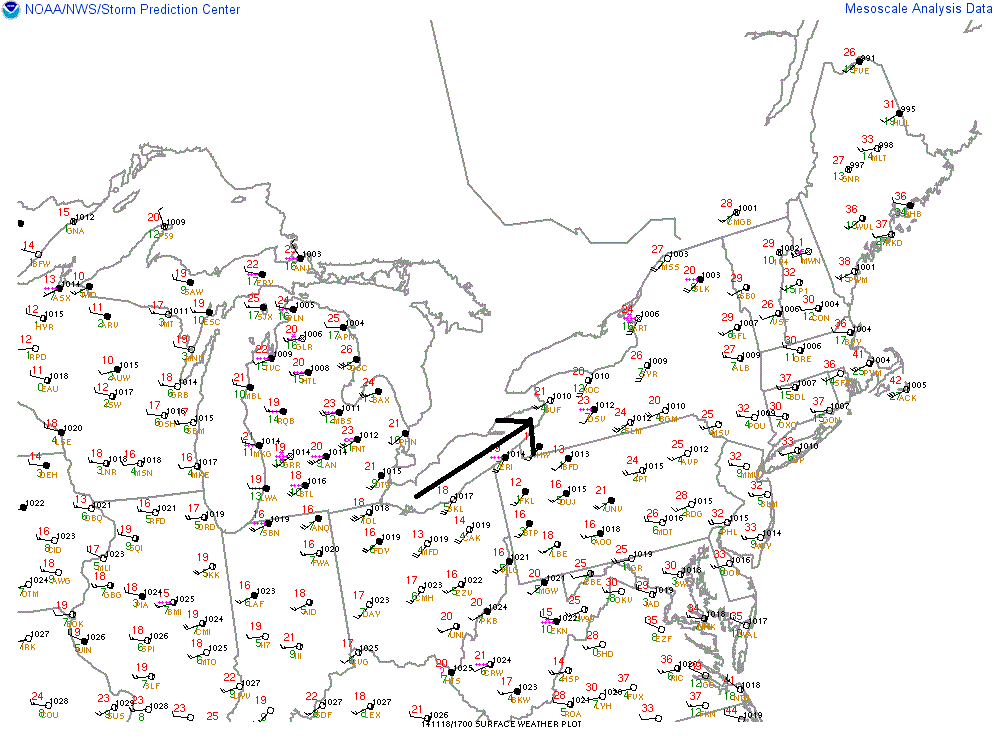 [Surface map showing southwest winds over Lake Erie which is perfect setup for Buffalo; courtesy NOAA]
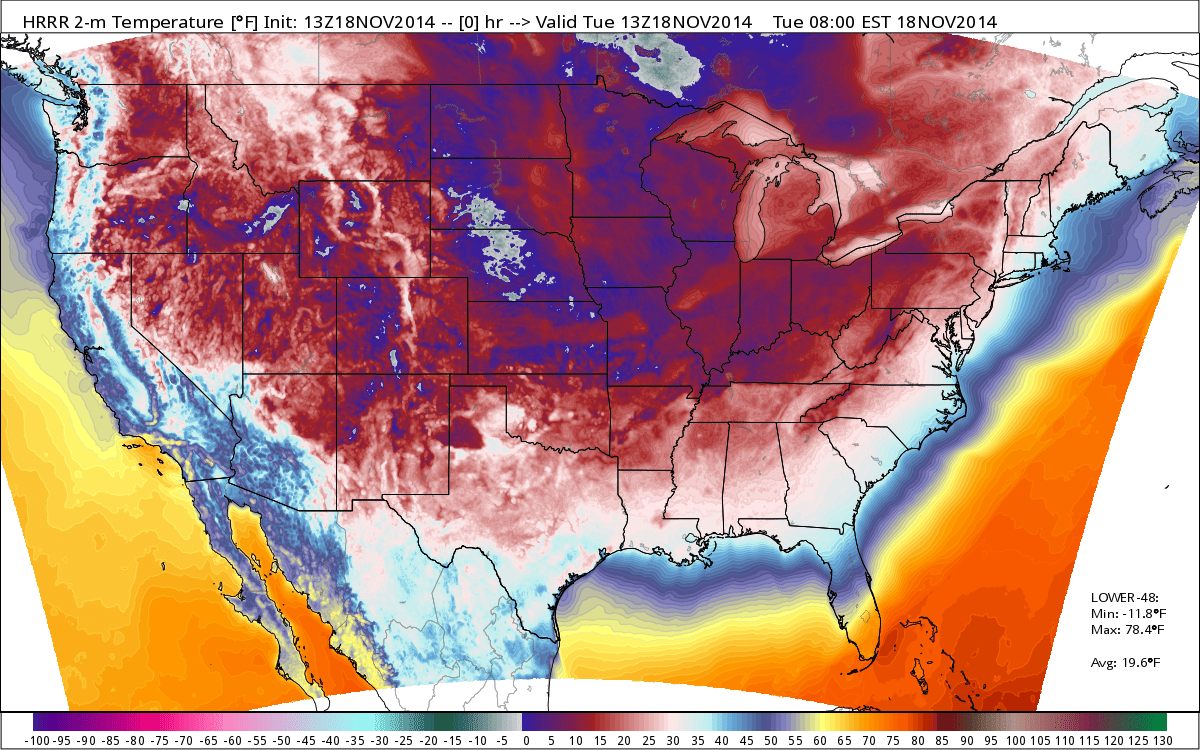 [Coldest November day across the nation since 1976; map and data courtesy Weather Bell Analytics]
 [Current snow cover extent in the US is 50.4%; courtesy NOAA]
 [Clouds associated with the Arctic front extend from the Gulf of Mexico to New England; courtesy NOAA]
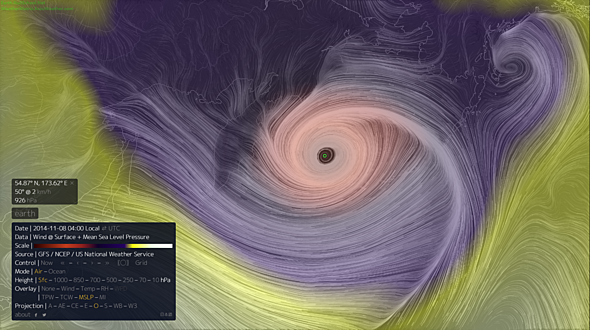 [Depiction of the forecasted wind field associated with this superstorm near Alaska; courtesy earth.nullschool.net]