
1:00 PM | ***Friday to Wednesday - the worst weather that winter has to offer***
Paul Dorian
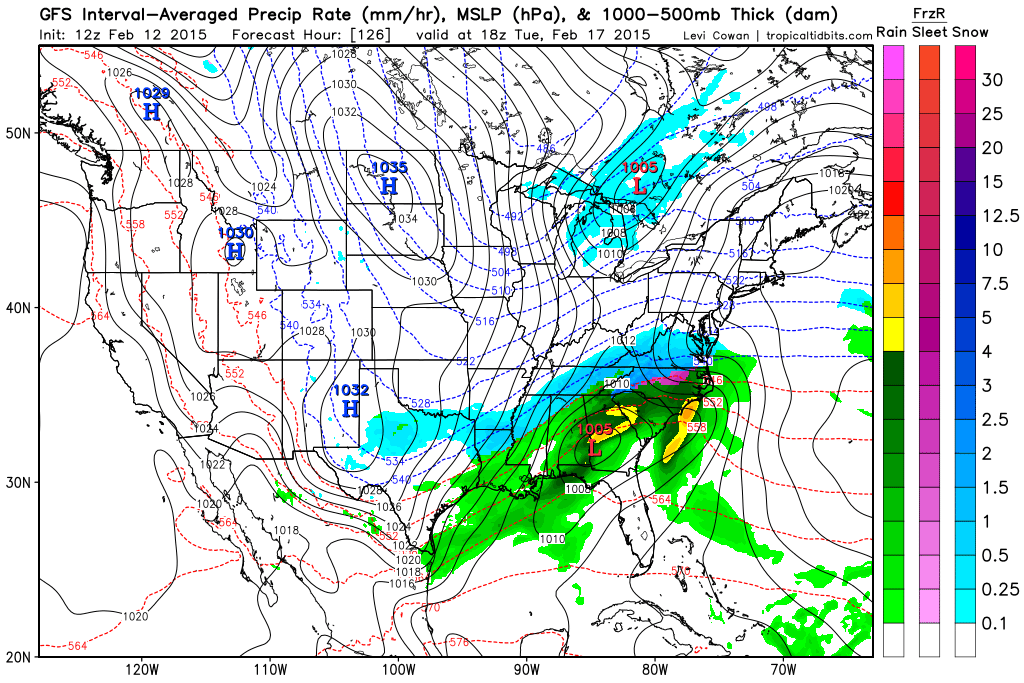 [12Z GFS forecast map for next Tuesday early afternoon (blue=snow); map courtesy "tropicaltidbits.com", NOAA]
Discussion
Overview Get ready; it’s going to be a wild ride. The stretch from Friday to Wednesday will feature some of the worst weather that winter can offer in this part of the country. All of the following are on the table for the 6-day period from tomorrow through next Wednesday:
- Painful cold with 0 degrees within reach (Sunday AM, Monday AM) - Weekend accumulating snow (late Saturday, Saturday night) - Very strong winds with potentially damaging wind gusts (Sunday) - Dangerous sub-zero wind chills (Friday and especially on Sunday) - Significant snow threat (late Tuesday into early Wednesday)
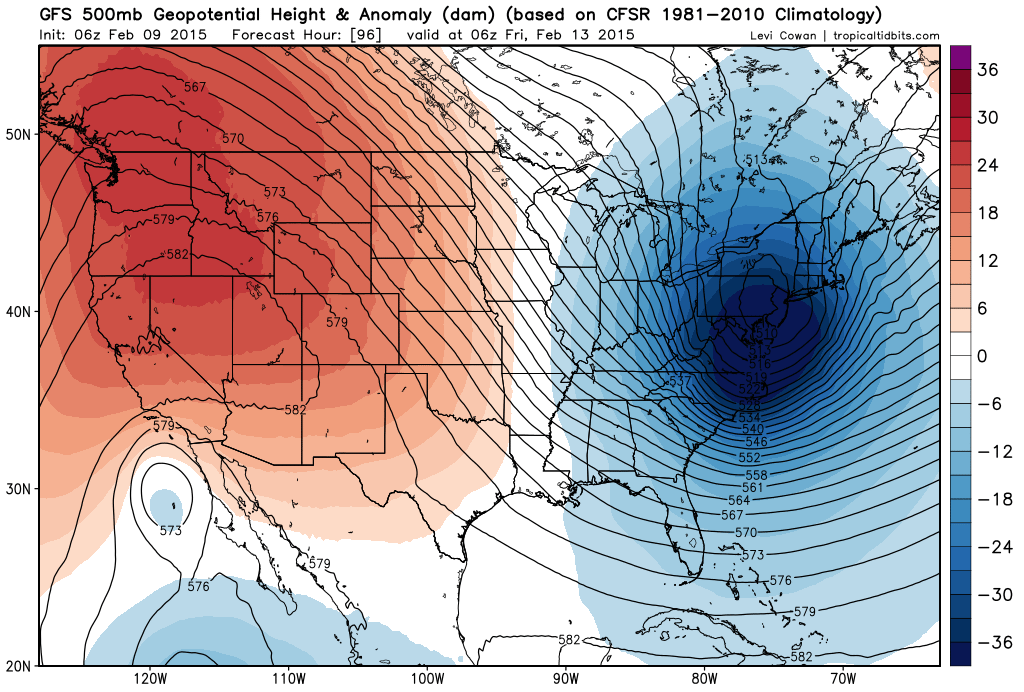
Here are the details: Arctic air arrives today in the Mid-Atlantic region accompanied by snow showers and increasing winds. Those winds will remain strong tonight and temperatures will plunge in the overnight hours into the single digits in many suburban locations by early Friday. The winds remain strong through much of the day on Friday and this will produce sub-zero wind chills at times before the wind finally relaxes noticeably early tomorrow night.
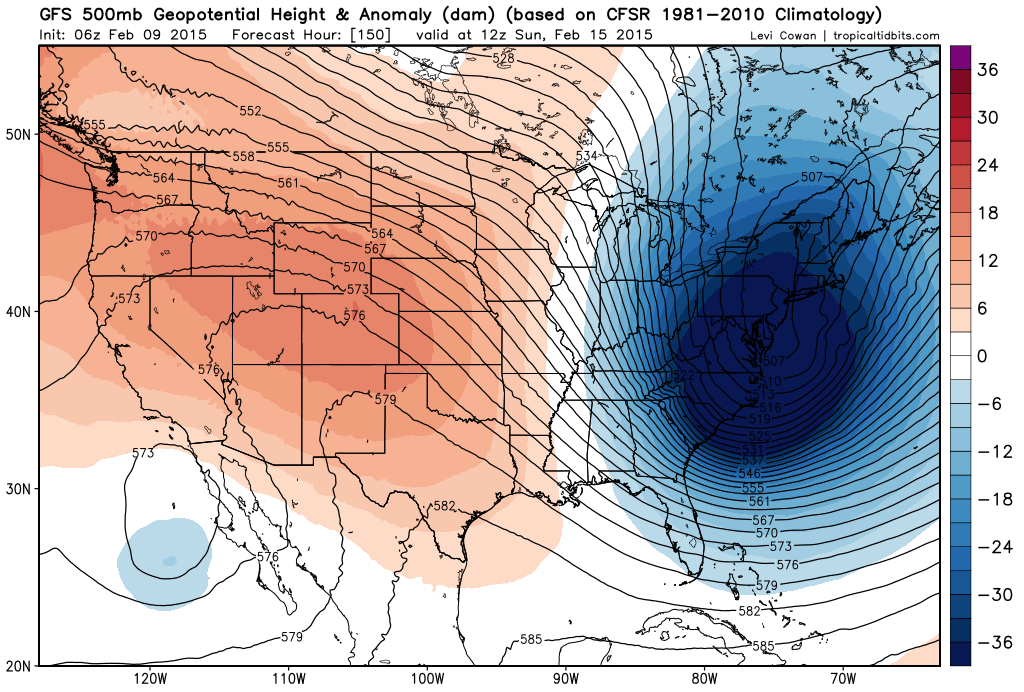
On Saturday, another clipper system and Arctic front will be plowing towards the I-95 corridor from the Great Lakes region. This system has more potential in terms of snowfall in our area compared with today’s frontal system. In fact, snowfall on the order of a coating to two inches is possible late Saturday and Saturday night in the DC metro region, 1-3 inches in Philly, and 2-5 inches in NYC associated with this next Arctic blast. Then, Sunday promises to be the coldest day yet with painful cold, dangerous sub-zero wind chills, and potentially damaging wind gusts past 50 mph. The last thing we need on Sunday is for scattered power outages to develop, but that possibility cannot be ruled out with the most powerful winds likely late Saturday night and early Sunday.
After a bitter cold start on Monday - near 0 degrees in many portions of the I-95 corridor - moisture will begin streaming towards us from the south-central US. The combination of very cold ground temperatures, an entrenched Arctic air mass in the Northeast US and copious amounts of “southern” moisture does not bode well for the Mid-Atlantic region. Indeed, this could turn into a significant snow event for the Mid-Atlantic region from late Tuesday into early Wednesday, but since the storm track cannot be pinned down quite yet, it is just too early to make this call. And yes, this mid-week storm will be followed by more brutal cold.
Buckle up…the next 6 days will be quite interesting.
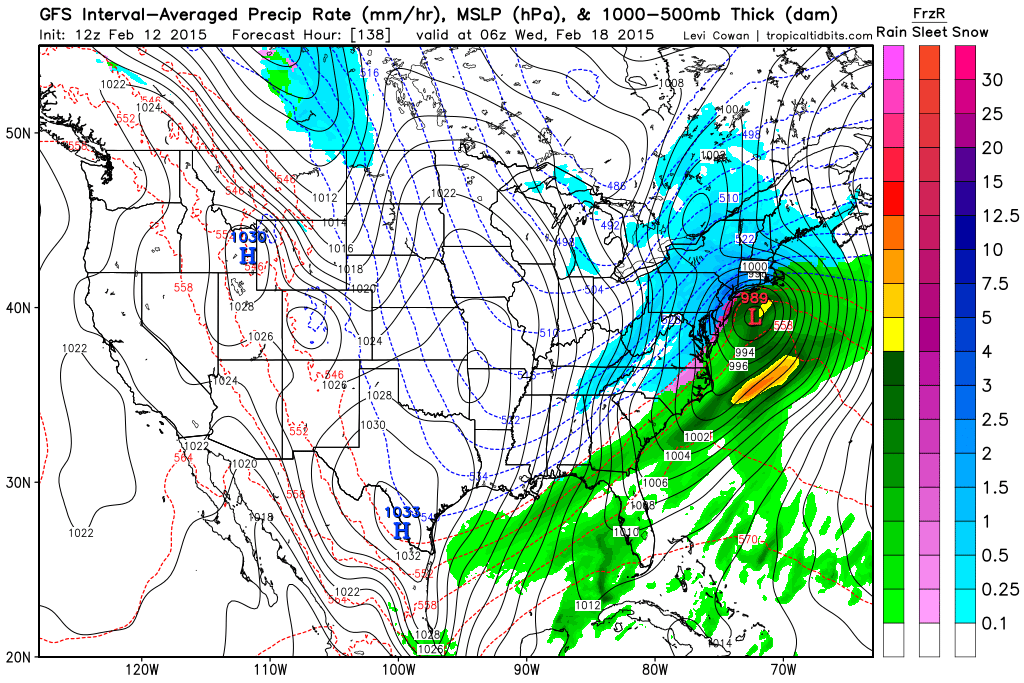 [12Z GFS forecast map for late Tuesday night (blue=snow); map courtesy "tropicaltidbits.com", NOAA]
Video
httpv://youtu.be/7vLfp462510
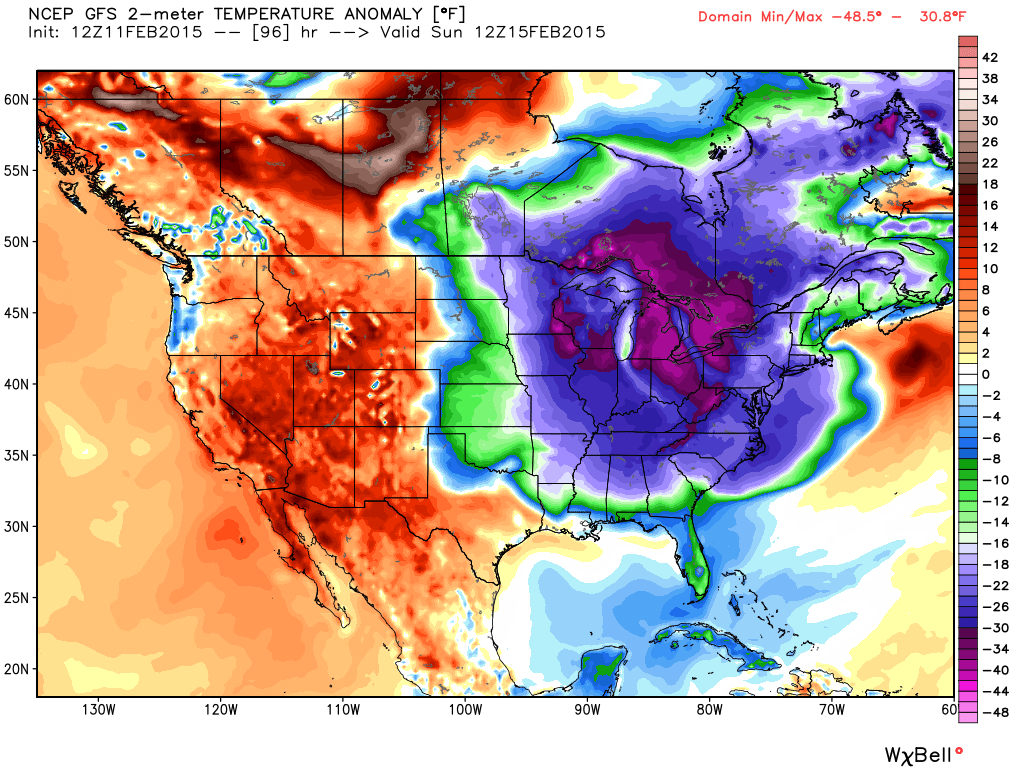
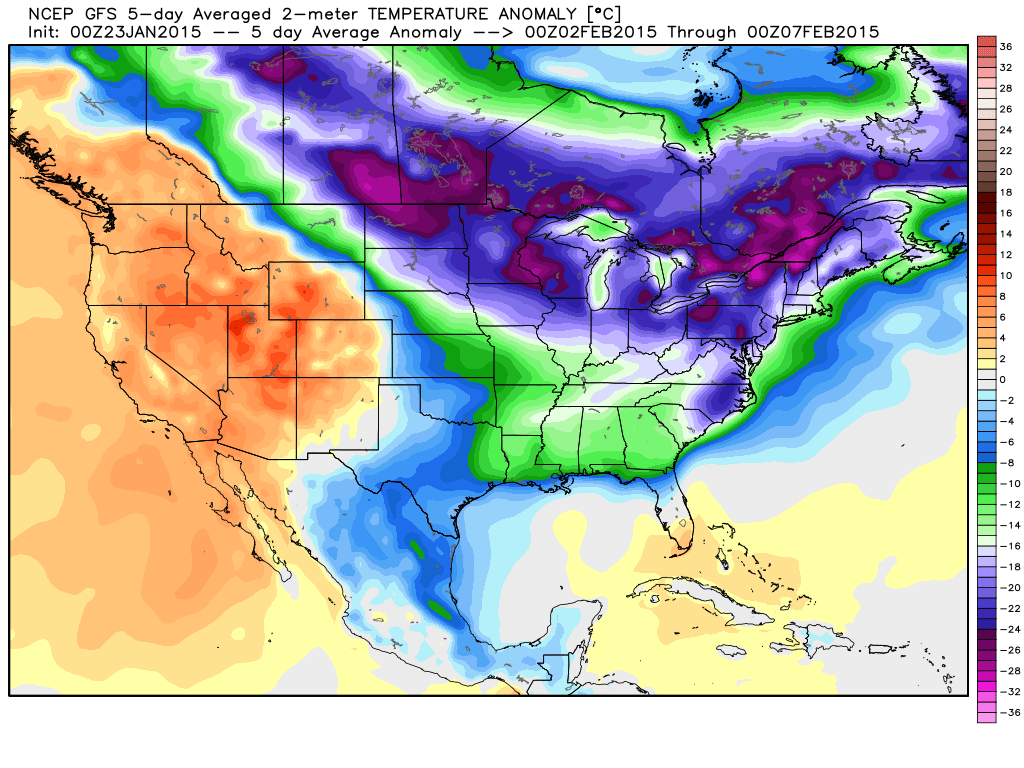 [GFS 2-meter temperature anomaly forecast map for 5-day period of 2/2-2/7; map courtesy Weather Bell Analytics at weatherbell.com]
 [GFS Ensemble height anomaly forecast map for February 1st; courtesy Penn State eWall]
 [00Z GFS Ensemble forecast map of 500 millibar height anomalies late this month; map courtesy Penn State eWall]
 [Current sea surface temperature anomaly chart; courtesy NOAA]
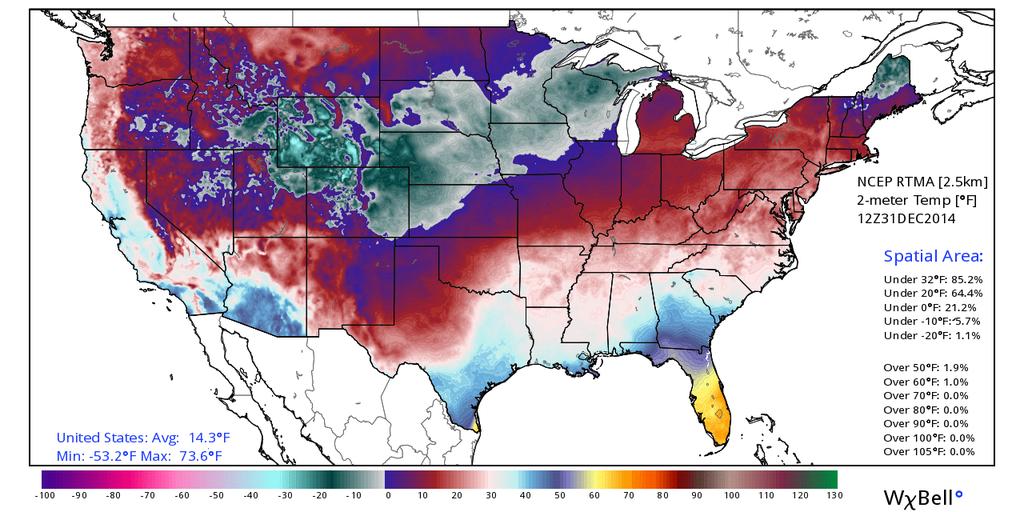 [7AM temperature map across the nation with average CONUS temperature of 14.3°F; map and data courtesy Ryan Maue of Weather Bell Analytics at "weatherbell.com"]
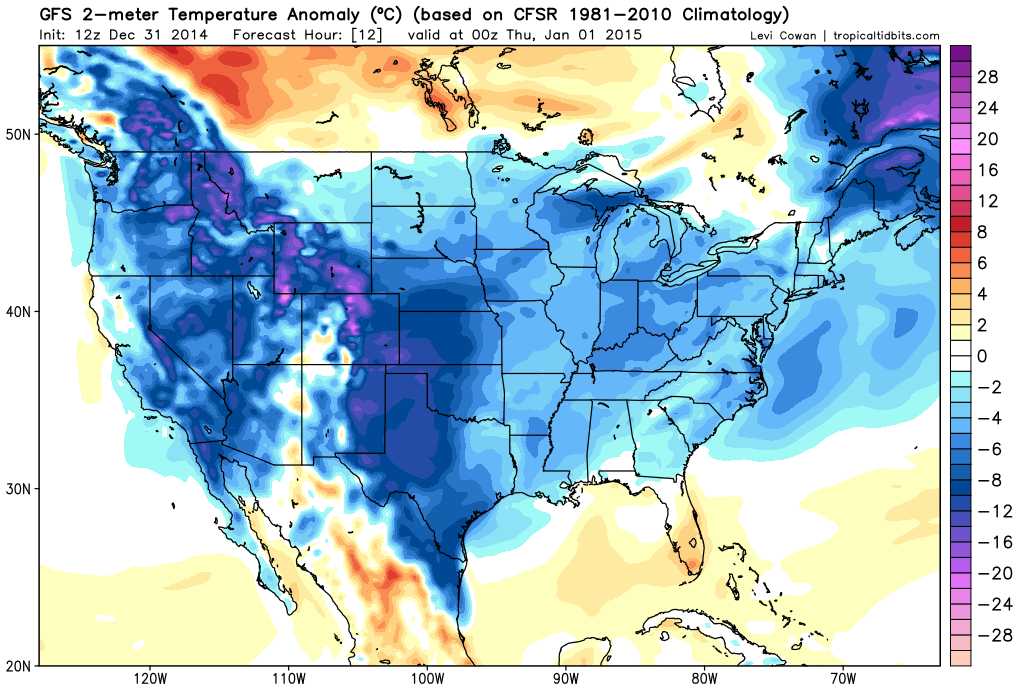 [12Z GFS 2-meter temperature anomaly forecast map for early tonight; map courtesy "tropicaltidbits.com"]
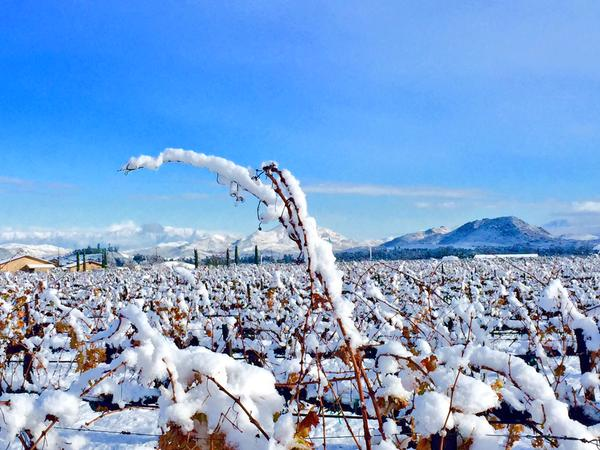 [Southern California (Temecula) vineyard in the deep freeze this morning]
 [Yellow line represents southern hemisphere sea ice areal extent throughout 2014; courtesy University of Illinois "cryosphere"; NOAA/NCEP]
 [red line represents global sea ice areal extent relative-to-normal (zero line); courtesy University of Illinois "cryosphere"; NOAA/NCEP]
 [Yellow line represents northern hemisphere sea ice areal extent throughout 2014; courtesy University of Illinois "cryosphere"; NOAA/NCEP]
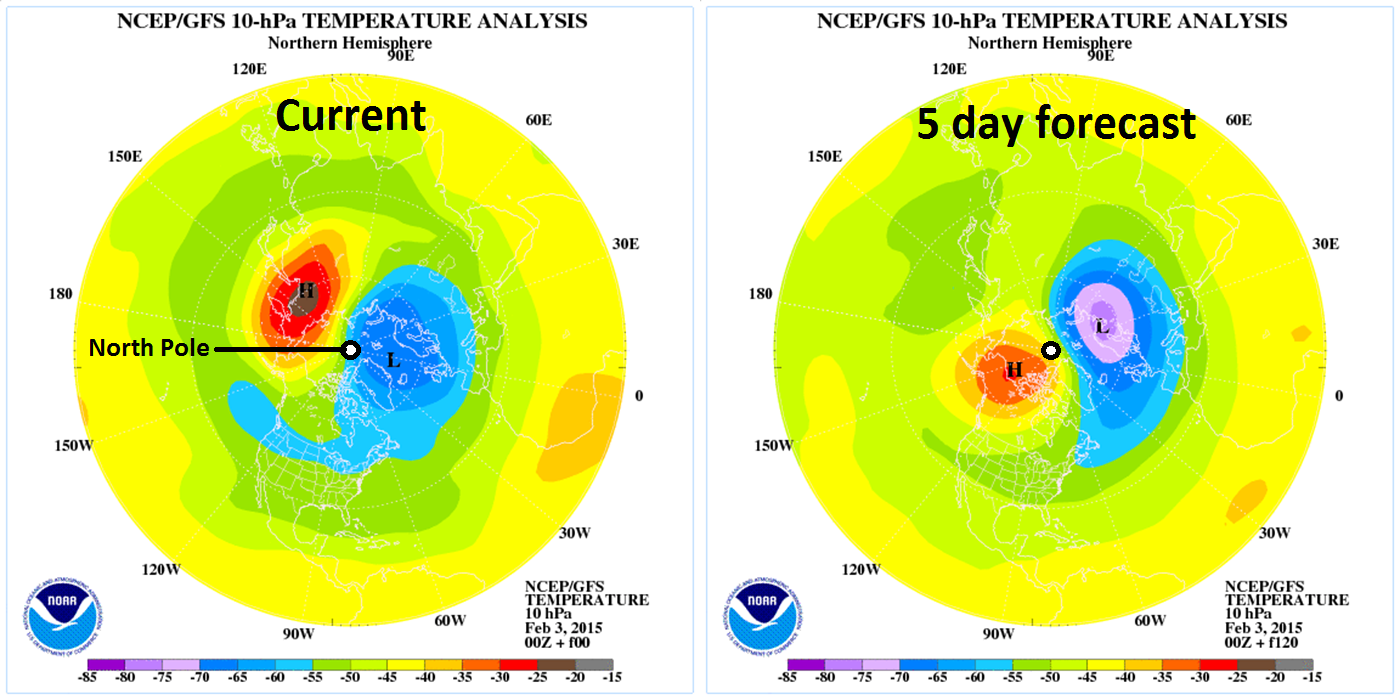
 [Polar view of current stratospheric (10-millibars) temperature pattern and the 10-day forecast using the GFS model; courtesy NOAA]
 [Stratospheric (10-millibars) temperature plot for 2013 and 2014 in high latitude region of 90N to 65N; courtesy NOAA]