Contact Us

Use the form on the right to contact us.

You can edit the text in this area, and change where the contact form on the right submits to, by entering edit mode using the modes on the bottom right. 


123 Street Avenue, City Town, 99999

(123) 555-6789

email@address.com


You can set your address, phone number, email and site description in the settings tab.
Link to read me page with more information.

backlit-stratus-clouds-2013-04-05.jpg

Blog

Weather forecasting and analysis, space and historic events, climate information

Filtering by Category: Climate Info

11:00 AM | *The sun has gone quiet again during the weakest solar cycle in more than a century*

Paul Dorian

latest_solar_image
latest_solar_image

[Latest solar image with little sunspot activity; courtesy "spaceweather.com"]

Discussion

Overview

The main driver of all weather and climate, the entity which occupies 99.86% of all of the mass in our solar system, the great ball of fire in the sky – has gone quiet again during what is likely to be the weakest sunspot cycle in more than a century. For the past 5 days, solar activity has been very low and one measure of solar activity – its X-ray output – has basically flatlined in recent days (plot below courtesy NOAA/Space Weather Prediction Center). Not since cycle 14 peaked in February 1906 has there been a solar cycle with fewer sunspots. We are currently more than six years into Solar Cycle 24 and today the sun is virtually spotless despite the fact that we are still in what is considered to be its solar maximum phase. Solar cycle 24 began after an unusually deep solar minimum that lasted from 2007 to 2009 which included more spotless days on the sun compared to any minimum in almost a century.

x-ray output flatlined

[The flatlining of solar X-ray output in recent days; courtesy NOAA/SWPC]

Solar maximum

The sun goes through a natural solar cycle approximately every 11 years. The cycle is marked by the increase and decrease of sunspots which are visible dark regions on the sun’s surface and cooler than surroundings. The greatest number of sunspots in any given solar cycle is designated as the “solar maximum" and the lowest number is referred to as the “solar minimum” phase. There was an uptick in the number of sunspots in April 2014 which produced a second peak during solar cycle 24 and it is looking increasingly likely that this will be considered the solar maximum point for this particular cycle (figure below courtesy NASA). Many solar cycles are double peaked; however, this is the first one in which the second peak in sunspot number was larger than the first peak which occurred in February 2012. Going back to 1755, there have been only a few solar cycles in the previous 23 that have had a lower number of sunspots during its maximum phase.

solar_cycle_24
solar_cycle_24

[Sunspot numbers for solar cycles 23 and 24 (current) with second peak; courtesy NASA]

Consequences of a weak solar cycle

First, the weak solar cycle has resulted in rather benign “space weather” in recent times with generally weaker-than-normal geomagnetic storms. By all Earth-based measures of geomagnetic and geoeffective solar activity, this cycle has been extremely quiet. However, while a weak solar cycle does suggest strong solar storms will occur less often than during stronger and more active cycles, it does not rule them out entirely. In fact, the famous Carrington Event of 1859 occurred during a weak solar cycle (#10) [http://thesiweather.com/2014/09/02/300-pm-the-carrington-event-of-1859-a-solar-superstorm-that-took-places-155-years-ago/]. In addition, there is some evidence that most large events such as strong solar flares and significant geomagnetic storms tend to occur in the declining phase of the solar cycle. In other words, there is still a chance for significant solar activity in the months and years ahead.

Second, it is pretty well understood that solar activity has a direct impact on temperatures at very high altitudes in a part of the Earth’s atmosphere called the thermosphere. This is the biggest layer of the Earth’s atmosphere which lies directly above the mesosphere and below the exosphere. Thermospheric temperatures increase with altitude due to absorption of highly energetic solar radiation and are highly dependent on solar activity.

Finally, if history is a guide, it is safe to say that weak solar activity for a very prolonged period of time (several decades) can have a negative impact on global temperatures in the troposphere which is the bottom-most layer of Earth’s atmosphere - and where we all live. There have been two notable historical periods with decades-long episodes of low solar activity. The first period is known as the “Maunder Minimum”, named after the solar astronomer Edward Maunder, and it lasted from around 1645 to 1715. The second one is referred to as the “Dalton Minimum”, named for the English meteorologist John Dalton, and it lasted from about 1790 to 1830. Both of these historical periods coincided with below-normal global temperatures in an era now referred to by many as the “Little Ice Age”. In addition, research studies in just the past couple of decades have found a complicated relationship between solar activity, cosmic rays, and clouds on Earth. This research suggests that in times of low solar activity where solar winds are typically weak; more cosmic rays reach the Earth’s atmosphere which, in turn, has been found to lead to an increase in certain types of clouds that can act to cool the Earth.

Outlook

The increasingly likely outcome for another historically weak solar cycle continues the recent downward trend in sunspot cycle strength that began over twenty years ago during solar cycle 22. If this trend continues for the next few cycles, then there would likely be more talk of another “grand minimum” for the sun. Some solar scientists are already predicting that the next solar cycle, #25, will be even weaker than this current one. However, it is just too early for high confidence in those predictions since some solar scientists believe that the best predictor of future solar cycle strength involves activity at the sun’s poles during a solar minimum and the next solar minimum is still likely several years away.

Paul Dorian Vencore, Inc.
8:30 AM | ****Incredible looking overall long-term pattern: afternoon/night accumulating snow with heavy squalls, damaging winds late tonight/early Sunday with possible power outages, painful cold on Sunday, multiple additional snow threats and brutal cold air outbreaks****

Paul Dorian

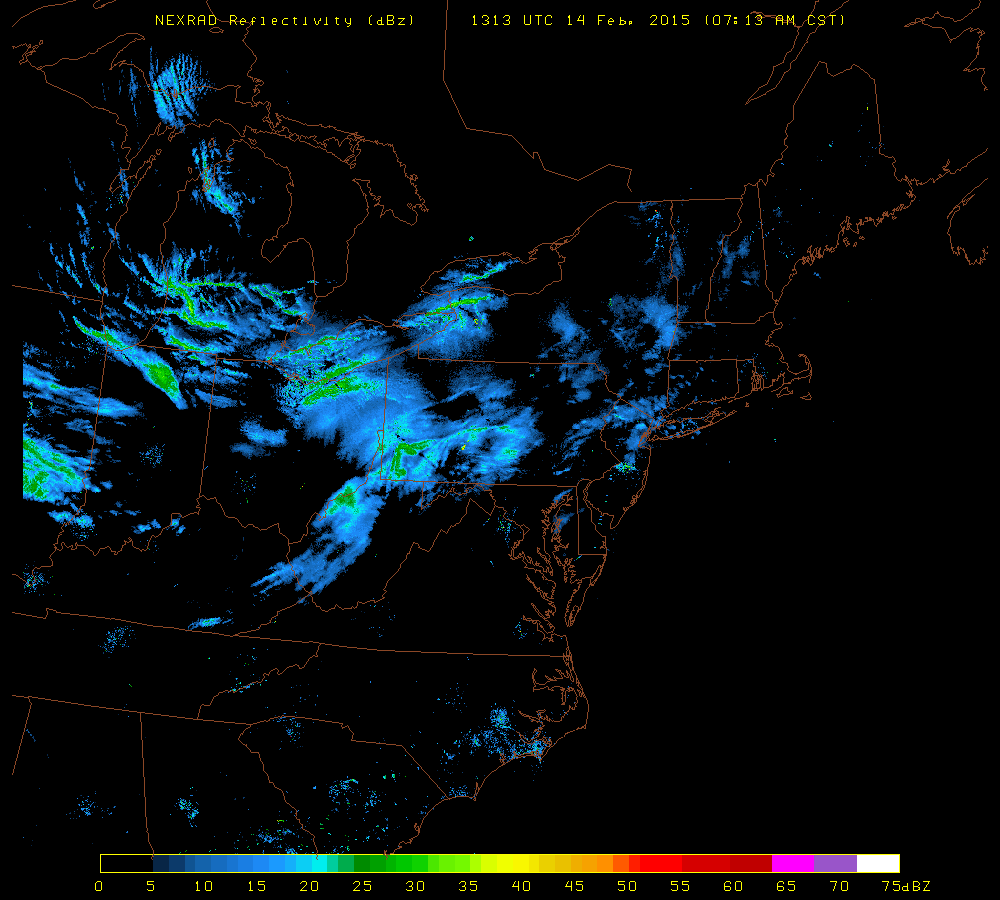
radar[Early morning NEXRAD radar image with snow over the Great Lakes/Ohio Valley and headed our way; image courtesy University of Wisconsin]
Discussion

The next 24-36 hours will bring us accumulating snow with heavy squalls, high impact winds, painful cold and dangerous sub-zero wind chills as a result of tremendous intensification of a storm system off the Northeast US coastline. This storm is currently located over southeastern Ontario and it will drop rapidly today towards the I-95 corridor region. Once this system reaches the coastal waters it will deepen explosively by some 36 millibars in a 24-hour period. The combination of the relatively warm waters of the western Atlantic Ocean, an extremely vigorous upper-level wave of energy, and a powerful upper-level jet streak will help cause this rapid intensification during the next 24 hours or so. This type of rapid and significant intensification will lead to a very sharp pressure gradient across the Northeast US which, in turn, will lead to extreme wind gusts on the order of 55 mph or so in the period between late tonight and Sunday morning (approximately 3 am to noon). Unfortunately, power outages are quite possible with this type of wind from late tonight into early which is the same time the coldest air of the season comes pouring into the region. Winds will slowly decrease later Sunday afternoon and evening.

As far as the snow is concerned, while there can be some snow seen this morning, the majority of the snow showers and possible heavier snow squalls should occur this afternoon and continue this evening. The snow part of this event will really consist of two parts: one part associated with the Arctic front from this afternoon into the late evening hours and then the second part associated with the developing storm late tonight and early Sunday. Some of the snow squalls this afternoon and evening can be quite intense with brief heavy snowfall, gusty winds, very poor visibility ("white out" conditions) and quick accumulations. Late tonight and early tomorrow will pose another chance for additional snowfall from eastern PA northeast across New Jersey and New York City as the storm deepens rapidly off the coastline. In fact, New York City could end up with its heaviest snowfall during this latter portion of the storm when an “inverted trough” extends to the northwest of the intensifying surface low pressure center. One final note on the snow, it is possible that some "thunder snow" occurs during the next 24 hour in portions of the I-95 corridor given this tremendous upper-level suport and upward motion in the atmosphere.

Accumulations by tomorrow morning are likely to be in the 1-3 inch range across Philly, a coating to 2 inches in the DC metro region, and 2-5 inches in and around NYC metro region. However, we'll have to watch for a potential surprise late tonight and early Sunday for additional snowfall in the Philly metro region and especially in the New York City metro region which could add to these preliminary accumulation estimates. Much of the snow that does accumulate will be whipped around by powerful winds late tonight and on Sunday with considerable blowing and drifting possible in some areas. Temperatures are likely to drop to single digits by early tomorrow throughout the I-95 corridor, then struggle to rise at all during the day, and then plunge to possible record-breaking territory by early Monday morning in the area of 0 degrees or even slightly below.

Another system could throw significant accumulating snow our way late Tuesday into early Wednesday, but that storm track is still somewhat uncertain. However, what is quite certain is that there will be more bitter cold air for the second half of next week and beyond and there will be multiple additional snow threats as an unbelievable long-term pattern is shaping up for the Mid-Atlantic region.

1:00 PM | ***Friday to Wednesday - the worst weather that winter has to offer***

Paul Dorian

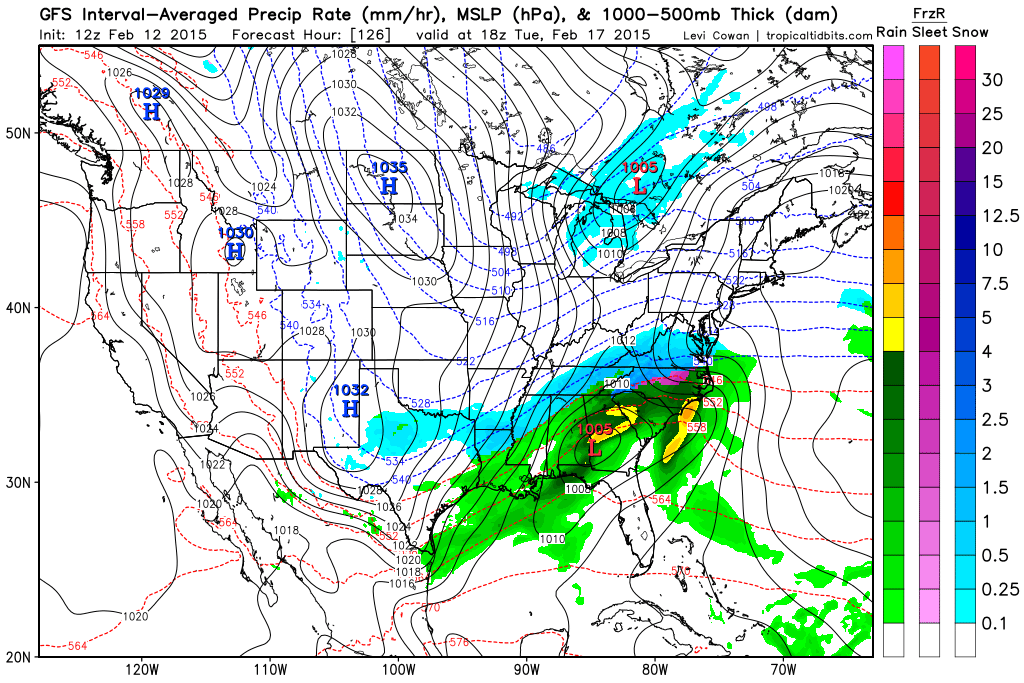
Tues_PM_fcst[12Z GFS forecast map for next Tuesday early afternoon (blue=snow); map courtesy "tropicaltidbits.com", NOAA]
Discussion

Overview Get ready; it’s going to be a wild ride. The stretch from Friday to Wednesday will feature some of the worst weather that winter can offer in this part of the country. All of the following are on the table for the 6-day period from tomorrow through next Wednesday:

- Painful cold with 0 degrees within reach (Sunday AM, Monday AM) - Weekend accumulating snow (late Saturday, Saturday night) - Very strong winds with potentially damaging wind gusts (Sunday) - Dangerous sub-zero wind chills (Friday and especially on Sunday) - Significant snow threat (late Tuesday into early Wednesday)

Here are the details: Arctic air arrives today in the Mid-Atlantic region accompanied by snow showers and increasing winds. Those winds will remain strong tonight and temperatures will plunge in the overnight hours into the single digits in many suburban locations by early Friday. The winds remain strong through much of the day on Friday and this will produce sub-zero wind chills at times before the wind finally relaxes noticeably early tomorrow night.

On Saturday, another clipper system and Arctic front will be plowing towards the I-95 corridor from the Great Lakes region. This system has more potential in terms of snowfall in our area compared with today’s frontal system. In fact, snowfall on the order of a coating to two inches is possible late Saturday and Saturday night in the DC metro region, 1-3 inches in Philly, and 2-5 inches in NYC associated with this next Arctic blast. Then, Sunday promises to be the coldest day yet with painful cold, dangerous sub-zero wind chills, and potentially damaging wind gusts past 50 mph. The last thing we need on Sunday is for scattered power outages to develop, but that possibility cannot be ruled out with the most powerful winds likely late Saturday night and early Sunday.

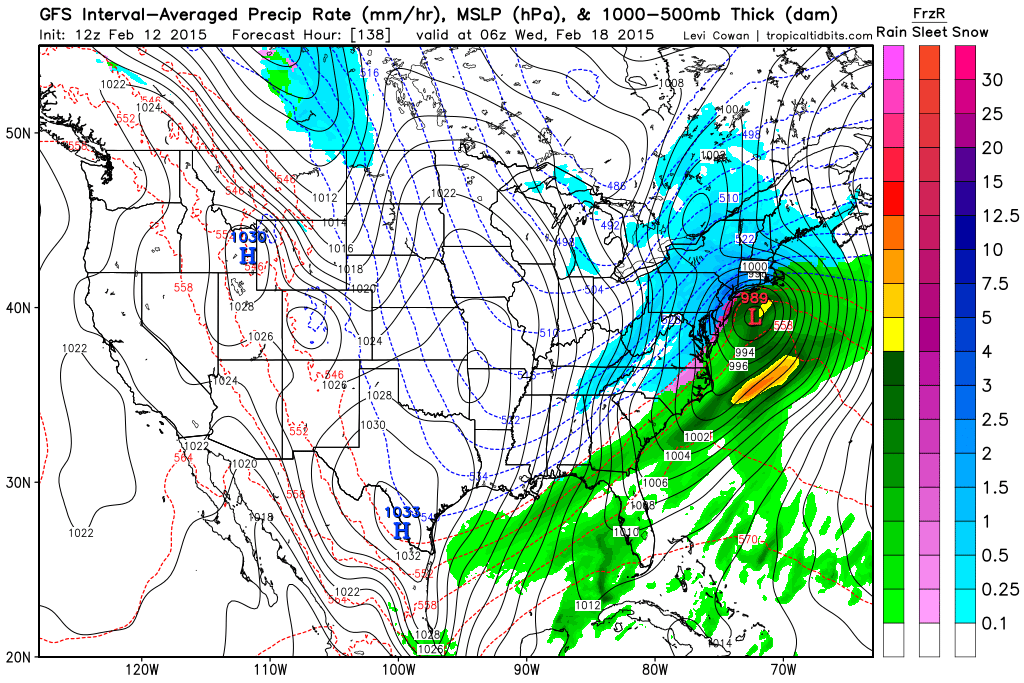
After a bitter cold start on Monday - near 0 degrees in many portions of the I-95 corridor - moisture will begin streaming towards us from the south-central US. The combination of very cold ground temperatures, an entrenched Arctic air mass in the Northeast US and copious amounts of “southern” moisture does not bode well for the Mid-Atlantic region. Indeed, this could turn into a significant snow event for the Mid-Atlantic region from late Tuesday into early Wednesday, but since the storm track cannot be pinned down quite yet, it is just too early to make this call. And yes, this mid-week storm will be followed by more brutal cold.

Buckle up…the next 6 days will be quite interesting.

gfs_late_tues_night [12Z GFS forecast map for late Tuesday night (blue=snow); map courtesy "tropicaltidbits.com", NOAA]
Video

httpv://youtu.be/7vLfp462510

1:30 PM | **Back-to-back Arctic invasions to produce amazing cold around here by early Sunday**

Paul Dorian

GFS_Sun_am_lows

Discussion

Overview The normal high temperature for today at Philly’s International Airport is 43 degrees and we are going to end the day several degrees below that mark, but this cold is nothing compared to the type of cold that is coming. Back-to-back Arctic invasions will send temperatures plummeting in the Mid-Atlantic region over the next few days and the second blast is likely to feature the coldest air of the season so far in much of the area from Maine to Florida. The last time temperatures dropped to less than 10 degrees in Philly during the month of February was in 1996 (6 degrees on 2/6/96). There is little doubt that Philly will see temperatures that low on Sunday morning (and again on Monday morning). The last time sub-zero readings occurred in Philly during the month of February was in 1979 (-2 degrees on 2/11/79) and this is not out of the question for the Sunday/Monday Arctic blast.

Thursday night/Friday Arctic blast A clipper system and its associated Arctic frontal system will arrive in the Mid-Atlantic region later tomorrow with scattered snow showers - perhaps even a heavier burst of snow - along with strengthening winds and then it’ll turn brutally cold behind it late tomorrow night and Friday. Temperatures early Friday could bottom out in the upper single digits in some suburban locations along I-95 and they will struggle to reach the 20’s on Friday along with much lower wind chill values.

Sunday/Monday Arctic blast Before that late work week Arctic air mass even has a chance to modify, another clipper system and its associated Arctic front will be plowing towards the Mid-Atlantic region. This system will be accompanied by snow for the I-95 corridor along with strengthening winds from later Saturday into early Sunday and it will usher in absolute frigid air for Sunday and Monday. The snow could turn out to be rather significant in portions of the Northeast US; especially, from New York City north and east. Sunday is liable to turn out to be the coldest day of the winter so far in much of the region between Maine and Florida. Low temperatures early Sunday morning and again early Monday morning could plunge to 0 degrees in many parts of the Mid-Atlantic region. High temperatures on Sunday will be confined to the teens in the I-95 corridor and with winds gusting up to 40 mph or so, there will be dangerously low (sub-zero) wind chill values.

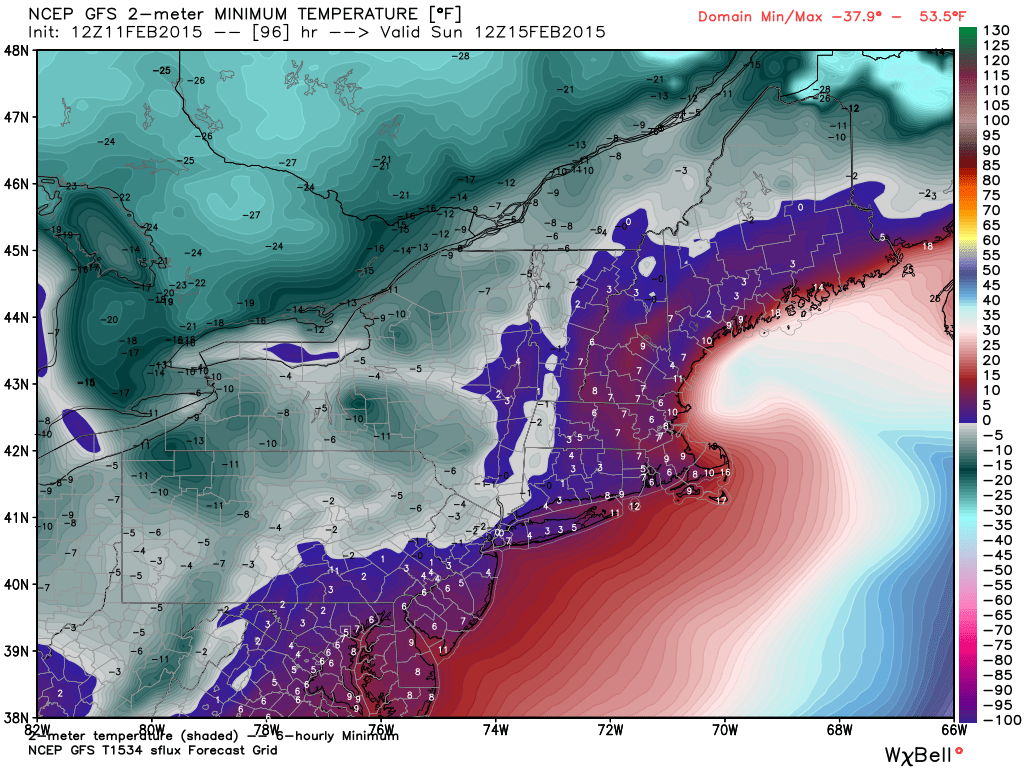
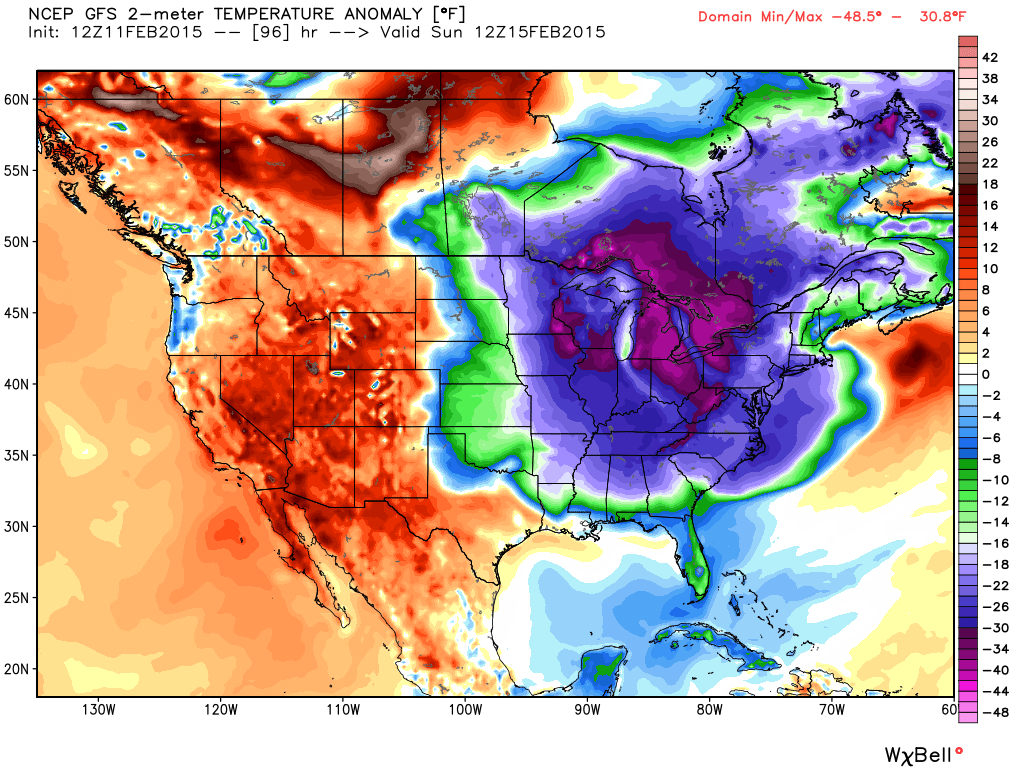
The 12Z GFS 96-hour forecast map for low temperatures on Sunday morning (above) show below zero readings just to the west of the NYC metro region, near zero in the Philly suburbs, and low-to-mid single digits near DC (map courtesy Weather Bell Analytics). The 12Z GFS 96-hour 2-meter temperature anomaly forecast map for Sunday (below) shows the entire eastern half of the nation in a deep freeze and some sections (in purple) are more than thirty degrees below normal for this time of year (map courtesy Weather Bell Analytics).

GFS_temp_anom_Sun_am

12:00 PM | **Stormy and cold pattern developing for the next few weeks with multiple Arctic air outbreaks and numerous storm threats**

Paul Dorian

Discussion

Overview The pattern setting up for the next few weeks looks quite active and cold with multiple Arctic air outbreaks and storm threats. The southern branch of the jet stream will become more active and this will push Pacific Ocean moisture into the southern US which can move across the nation into the eastern US. After today’s precipitation event, there will be a couple of tranquil days in the Mid-Atlantic region with moderately cold conditions, but then the next clipper type of low pressure system and its associated Arctic blast will be ready to pounce on the area by Thursday night. Before that late week Arctic air mass even has a chance to modify, another clipper system and associated Arctic invasion will be plunging towards the Mid-Atlantic region by Saturday night. Beyond that, it appears yet another storm threat is likely around Tuesday or so of next week and this one will feature lots of moisture from the southern states. That storm next week could ultimately turn into a significant winter storm for the Mid-Atlantic region, but the storm track is, of course, still uncertain this far in advance.

This afternoon and tonight Colder air continues to trickle into the I-95 corridor as our Monday progresses and this will lead to mainly frozen precipitation in the Philly and NYC metro regions for the rest of this event. In Philly, the intermittent precipitation should fall as sleet and/or snow this afternoon with a change to all snow likely tonight. Accumulations by later tonight can be on the order of a coating to an inch with slick spots on untreated surfaces. In the NYC metro region, any wintry mix early this afternoon is likely to become all snow by later this afternoon and accumulations of snow and ice by later tonight should be on the order of 1-2 inches with slick spots on untreated surfaces. In DC, any plain rain that falls this afternoon is likely to turn into a wintry mix of freezing rain and sleet tonight, perhaps even ending briefly as all snow late tonight. Slick spots are likely on untreated surfaces in the overnight hours and there can be a coating of snow and/or ice.

Thursday night clipper and powerful Arctic blast By late Thursday, the next clipper and powerful Arctic front will blast into the Mid-Atlantic region with strengthening winds and numerous snow showers which could even include a heavier snow squall and/or a period of steadier snow. The upper-level pattern at 500 millibars for Thursday night is quite impressive with a deep trough of low pressure situated right on top of the Mid-Atlantic region (below). This will allow for rapid development of the clipper system once it reaches the warmer waters of the western Atlantic and this could lead to an all-out blizzard for – you guessed it – portions of New England. Temperatures by early Friday will bottom out in the single digits in many suburban locations along the I-95 corridor.

500_mb_anomaly_Thurs_night

[500 millibar height anomaly forecast map for late Thursday night with deep upper-level trough over the Mid-Atlantic; map courtesy "tropicaltidbits.com"]

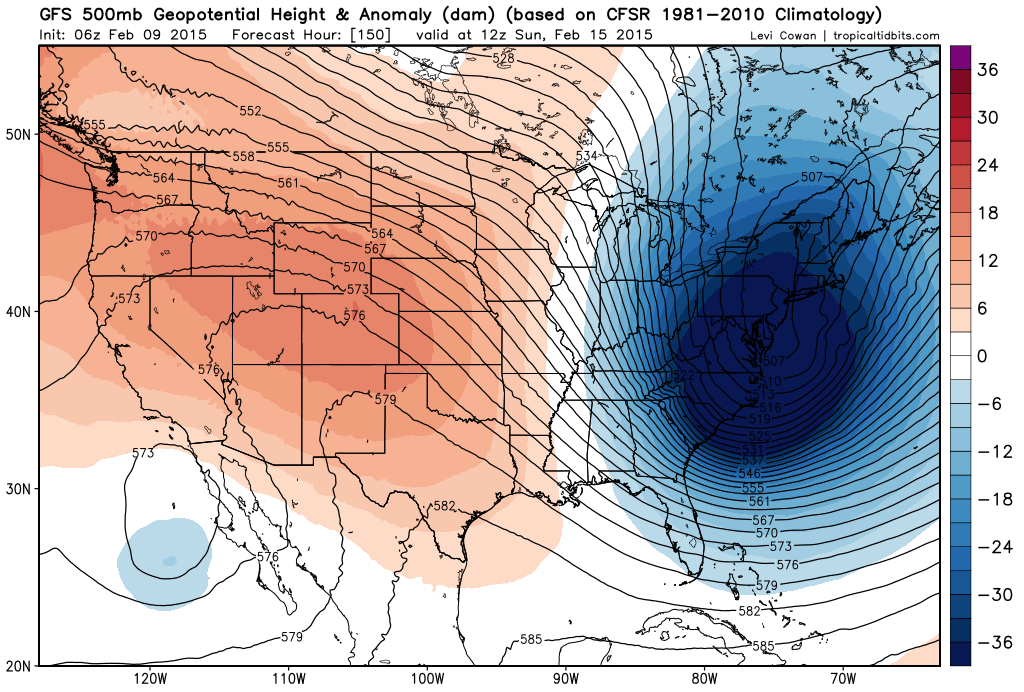
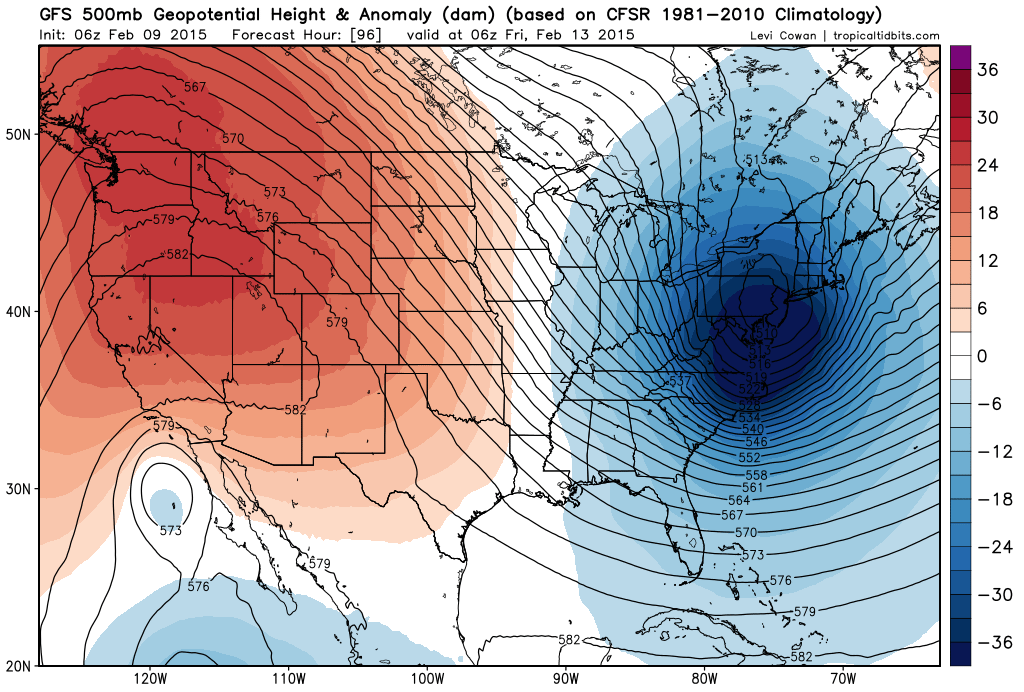
Saturday night clipper and powerful Arctic blast By late Saturday, another clipper system will be dropping southeastward from the Great Lakes region into the Mid-Atlantic and this system could generate numerous snow showers in the I-95 corridor late Saturday into early Sunday – perhaps even a period of steadier snow. Once again, a deep upper-level trough will develop in the Mid-Atlantic region (below) in very similar fashion to the Thursday night Arctic blast. As with the Thursday night event, this type of upper-level pattern may allow for rapid development of the clipper system once it reaches the warmer waters of the western Atlantic. This clipper will usher in another brutally cold Arctic air mass for the latter part of the weekend and the early part of next week. In fact, it may turn out that the temperatures early Sunday morning are at the lowest levels seen so far this winter in much of the Northeast US.

500_mb_anomaly_sun_am

[500 millibar height anomaly forecast map for Sunday morning with deep upper-level trough over the Mid-Atlantic; map courtesy "tropicaltidbits.com"]

10:00 AM | Stratospheric warming and the MJO: two far apart signals that suggest colder-than-normal weather in the northeastern US continues right through February and perhaps well into March

Paul Dorian

Discussion

Overview January 2015 was colder-than-normal in the northeastern US and it looks like that type of pattern may continue through February and perhaps well into March as well. Two separate signals that are far apart on the planet suggest cold weather could indeed continue in the northeastern U.S. for the foreseeable future. The first signal is coming from a tropical disturbance known as the Madden Julian Oscillation (MJO) and the second signal is coming from the highest part of the atmosphere over the North Pole.

Madden Julian Oscillation (MJO) The MJO is a tropical disturbance that propagates eastward around the global tropics with a cycle on the order of 30-60 days. It is a large-scale coupling between atmospheric circulation and tropical deep convection. The MJO has wide ranging impacts on the patterns of tropical and extratropical precipitation, atmospheric circulation, and surface temperature around the global tropics and subtropics. Furthermore, the MJO influences both precipitation and surface temperature patterns across the US. Specifically, one significant impact of the MJO in the U.S. during the northern hemisphere winter is an increase in the frequency and intensity of cold air outbreaks across the central and eastern US.

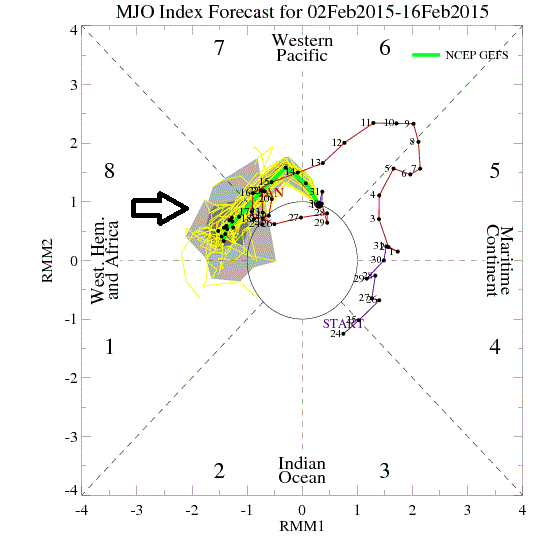
MJO_headed_to_phase_8

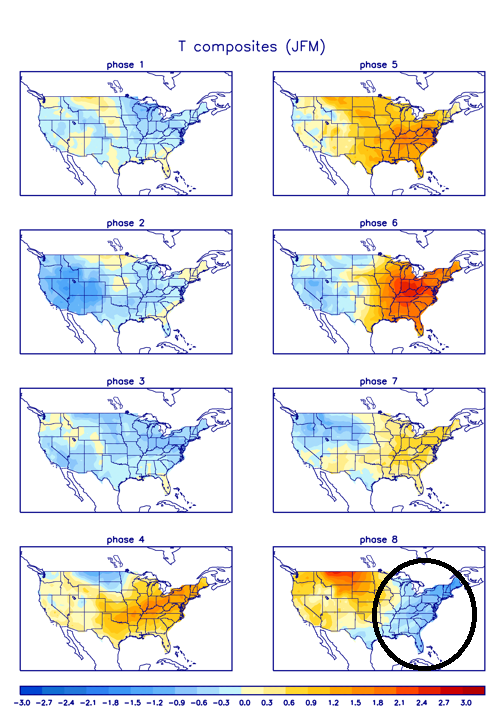
MJO Phases Research has found that the location of the MJO, or phase, is linked with certain temperature and precipitation patterns around the world. The MJO phase diagram (above) illustrates the recent and forecasted progression of the MJO index through different phases which generally coincide with locations along the equator around the globe. When the index is within the center circle, the MJO is considered weak, meaning it is difficult to discern. Outside of this circle, the index is stronger and will usually move in a counter-clockwise direction as the MJO moves from west to east. The very latest NOAA GFS Ensemble model forecast of the MJO index propagates it from its current "phase 6" location into "phase 8" as we progress towards mid-February (follow green line in figure above in a counter-clockwise fashion). Phase 8 for the MJO index this time of year (January/February/March) typically signals colder-than-normal temperatures in the eastern U.S. (see circled area below in "phase 8" temperature anomaly chart).

mjo_phases

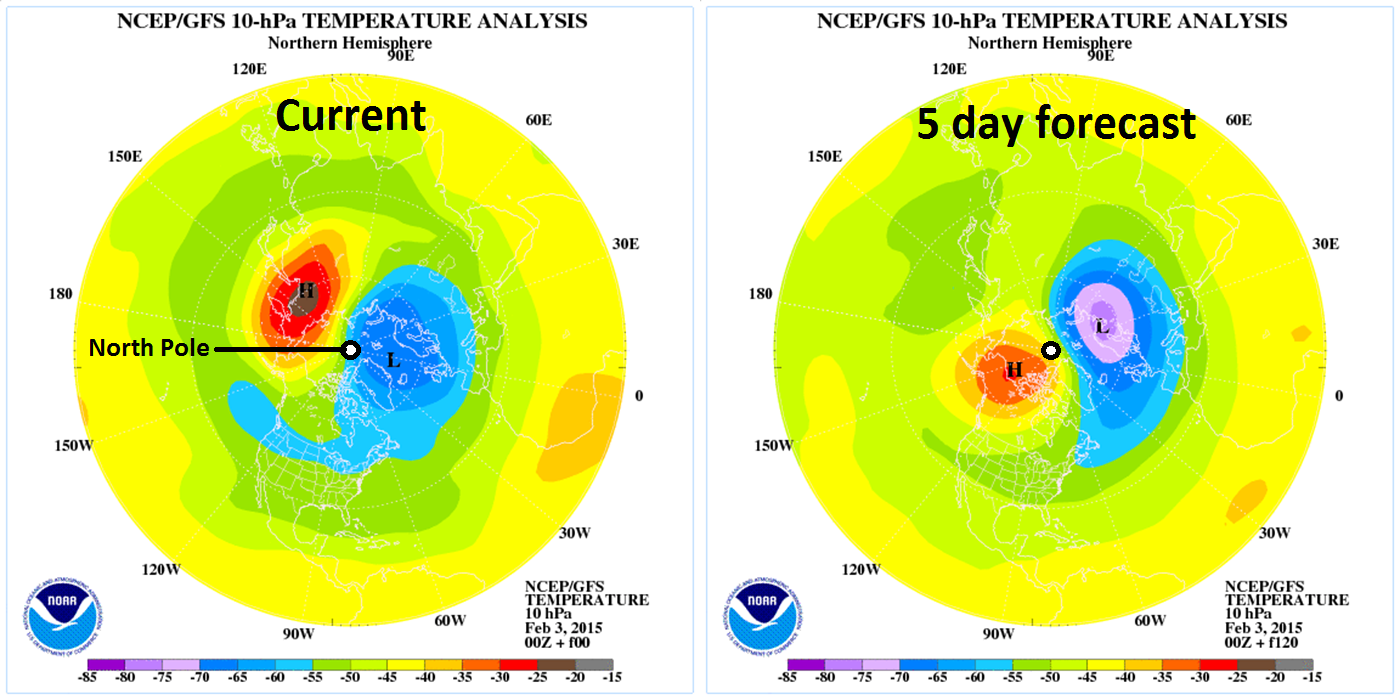
Sudden Stratospheric Warming (SSW) Another way to monitor the potential for Arctic air outbreaks in the northeastern U.S. is to follow what is happening in the stratosphere over the polar region of the northern hemisphere. Sudden stratospheric warming (SSW) events in the region of the North Pole have been found to set off a chain of events in the atmosphere that ultimately lead to Arctic air outbreaks from central Canada into the northeastern U.S. Indeed, there appears to be a significant stratospheric warming event in progress right now over the North Pole that could continue our colder-than-normal temperature pattern in the northeastern U.S. as we progress through the month of February and perhaps even into the month of March. The current stratospheric temperature pattern and the 5-day forecast are shown below and they show stratospheric warming at the North Pole during the next five days as the typical "polar-based" cold vortex is displaced towards Asia.

Picture1

SSW Consequences During the winter months in the lower polar stratosphere, temperatures on average are below minus 70 degrees Celsius. The cold temperatures are combined with strong westerly winds that form the southern boundary of the stratospheric polar vortex. The polar vortex plays a major role in determining how much Arctic air spills southward toward the mid-latitudes. This dominant structure is sometimes disrupted in some winters or even reversed. Under these circumstances, the temperatures in the lower stratosphere can rise by more than 50 degrees in just a few days. This sets off a reversal in the west-to-east winds and the collapse of the polar vortex. In recent SSW events, the polar vortex has split into two pieces and that opened the floodgates for Arctic air to move southward. In response to the stratospheric warming at the high latitudes, the troposphere in turn cools down dramatically and this cold air displacement is then transported from the tropospheric high latitudes to the tropospheric middle latitudes. This doesn’t mean that each and every day following an SSW event will be below normal as that will not be the case. However, it does suggest that, based on historical similarities, we could be looking at an overall below-normal temperature pattern in the northeastern U.S. through February and perhaps even well into March.

10:00 AM | ****Unfolding weather pattern to bring significant snow and brutal cold to the Mid-Atlantic region during the next few weeks and perhaps right through the month of February****

Paul Dorian

Discussion

Overview Some winters in the Mid-Atlantic region never bring significant snow. Some winters never feature the brutal cold that winter can offer. It is quite likely that we’ll get to experience both significant snow and brutal cold here in the Mid-Atlantic region during the next few weeks and that type of pattern with snow and cold could actually last right through the month of February. There will be numerous snow threats along the way beginning with the one from this evening into Saturday and then a second from Sunday night into Monday. In addition, brutal cold air outbreaks are likely to make numerous visits here as well during the next couple of weeks with the first one to arrive by Tuesday of next week. In fact, low temperatures by Wednesday morning could be sub-zero in many parts of the Northeast US and single digits in the I-95 corridor region from DC-to-Philly-to-NYC.

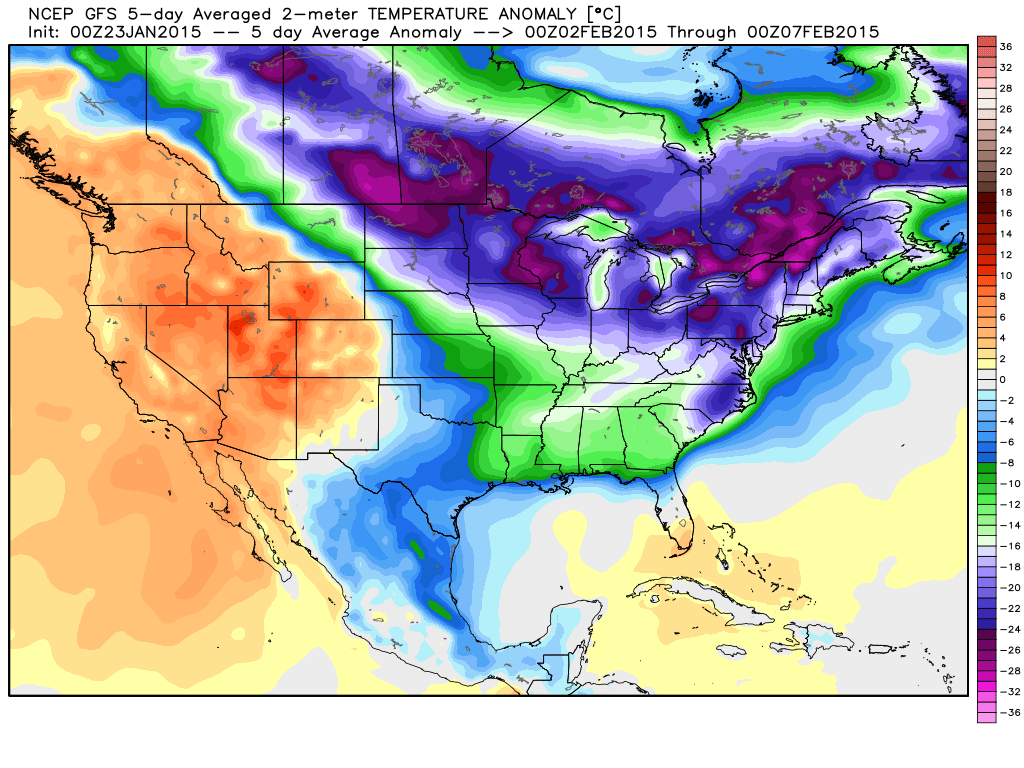
An especially interesting and scary-looking time period will be as we end January and begin February. Not only are there signs for a major coastal storm around February 1st (Super Bowl Sunday) or so, but brutal cold is likely to follow during the first few days of February that could bring temperatures to near zero again in many places across the Northeast US (see forecast map below for 2-meter temperature anomalies in the 5-day period from 2/2 to 2/7).

Feb_cold [GFS 2-meter temperature anomaly forecast map for 5-day period of 2/2-2/7; map courtesy Weather Bell Analytics at weatherbell.com]
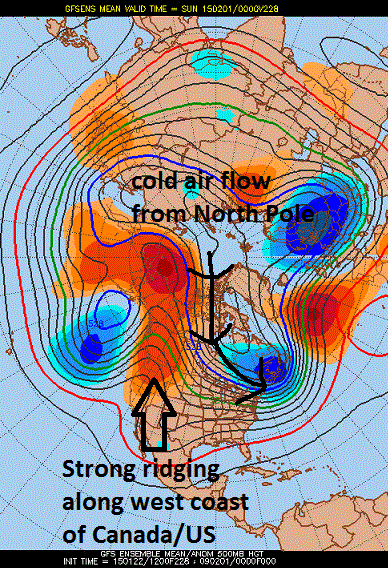
Temperatures and the connection to the 500 millibar height anomaly pattern One week ago we discussed the likelihood for strong ridging to develop along the west coast of North America as we progress into the latter part of January. Indeed, the forecast map (below) from yesterday’s 12Z GFS Ensemble run for February 1st continues to insist on strong ridging (oranges) along the west coasts of Canada and the US and this type of upper air pattern usually leads to multiple Arctic air mass incursions into the northern US from northern Canada. In fact, this forecast map suggests that the upper-level winds at 500 millibars – which tend to follow the height anomaly lines - could actually bring air directly from the North Pole into the northeastern US by the beginning of February.

f228 [GFS Ensemble height anomaly forecast map for February 1st; courtesy Penn State eWall]
Short-term snow threats Tonight/Saturday Precipitation from an intensifying coastal storm should reach the DC metro region early this evening (5pm or so), the Philly region between 9pm – 11pm, and NYC between 1 and 3am. The main thumping of snow from this system will be on its front end before a changeover takes place to freezing rain and sleet and perhaps even to plain rain from the cities to the coast. This event is likely to end in the DC metro region by early tomorrow afternoon, late afternoon in Philly and early evening in NYC. Snow and ice accumulation estimates are as follows:

1-3 inches in the northern and western suburbs of the District; lesser amounts in DC and points south and east 3-6 inches in the Philly and NYC metro regions and in their northern and western suburbs; lesser amounts to the south and east

Sunday night/Monday Another system will drop southeastward across the Great Lakes region late Sunday in much the same manner as some of the recent “clippers”. This system, however, has more potential than those as it will intensify in the Mid-Atlantic region on Monday, tap into some coastal moisture, and will have a cold air mass in place as it arrives. As a result, snow is likely to be the dominate precipitation type with this system on Sunday night and Monday and anywhere from several inches of snow are possible from DC-to-Philly-to-NYC. There is quite likely to be a significant disruption with the Monday morning commute due to the snowfall.

Buckle up, it’s going to be a wild ride.

Video

httpv://youtu.be/clS8roYhJ8k

9:00 AM | NOAA upgrades its main global computer forecast model (GFS) and enhances its computing power

Paul Dorian

Discussion

Overview Effective 12Z Wednesday, January 14th, 2015, NOAA’s Environmental Modeling Center (EMC) began running an upgraded version of its main computer global forecast model called the Global Forecast System (GFS). The upgraded GFS model has greater horizontal resolution compared to its predecessor version and the higher resolution runs now extend farther out in time. In preparation for the upgraded computer forecast model, NOAA has recently upgraded its computing capability with each of its two supercomputers by more than tripling their capacity. Much of this effort of upgrading the computer forecast model and computing capability was accelerated after Hurricane Sandy struck the Northeast US in 2012 as the main NOAA forecast model produced some inferior results in its prediction of the storm track when compared to its equivalent European counterpart.

Global Forecast System (GFS) The upgraded GFS model now has increased horizontal resolution in the first segment of its forecast package from 27 to 13 km and this higher resolution now extends out to 10 days whereas previously the higher resolution only went out to 7.5 days. The second segment of the GFS forecast package has seen an increase in horizontal resolution from 55 to 35 km which extends out from 10 days to 16 days. Furthermore, the upgraded model has enhanced physics and a better handling of important parameters such as sea surface temperatures, sea ice concentration, and snow depth which are all utilized by the model.

Computing power Modern numerical weather prediction uses the world’s most powerful computers and the associated software includes millions of lines of code. Some of the biggest computers in the world are used for weather and climate simulations. NOAA has upgraded its computing capability with each of its two supercomputers by more than tripling their capacity to at least 0.776 petaflops for a total capacity of 1.552 petaflops (a petaflop is a thousand trillion operations per second). The amount of data collected for operational numerical weather prediction is mind boggling. Petabytes of weather data are streaming to earth from dozens of weather satellites each day. In addition, hundreds of thousands of surface stations, roughly a thousand radiosondes, thousands of ships and buoys, thousands of aircraft, lightning detection networks, and other sensors are reporting each day adding up to hundreds of terabytes of information. All of this data is distributed around the world, quality controlled, and used to provide a physically consistent description of the three-dimensional atmosphere (info here provided courtesy Cliff Mass, University of Washington). Additional computing capacity and forecast model upgrades are scheduled by NOAA during the next few years.

9:00 AM | **Mid-winter update...cold pattern to continue and snow is sure to follow**

Paul Dorian

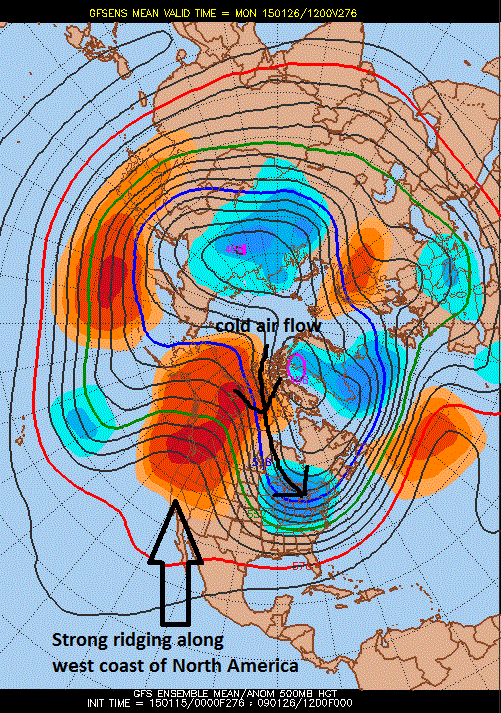
f276[00Z GFS Ensemble forecast map of 500 millibar height anomalies late this month; map courtesy Penn State eWall]
Discussion

Overview The first half of January has been colder-than-normal in much of the Mid-Atlantic region and indications are quite strong that the cold weather pattern will continue around here for the latter part of January and perhaps for much of February as well. In fact, there is reason to believe that the cold - relative to normal - could actually get much worse during the latter part of January and into early February compared to what we've experienced recently. So far this month, temperatures have averaged 3.5°F below normal at Philly International Airport in South Philadelphia, 3.7°F below normal in Central Park, New York, and 5.6°F below normal at Dulles Airport in Virginia. In addition, the colder-than-normal weather this month has extended across much of the eastern two/thirds of the nation and it is entirely possible that the nation as a whole ends up colder than last January which certainly was well below normal and made famous for its “polar vortex cold”. Snow, on the other hand, has been somewhat sporadic in the Mid-Atlantic region so far; however, sea surface temperature anomalies in both the Pacific and Atlantic Oceans - combined with the cold temperature outlook - suggest significant snowfall amounts are still possible as we progress through the second half of the winter season.

Temperatures and the connection to the 500 millibar height anomaly pattern There is reason to believe that a strong ridge will re-form along the west coast of North America as we progress into the latter part of January. Indeed, the forecast map (above) from last night's 00Z GFS Ensemble run for later this month features strong ridging (oranges) along the west coasts of Canada and the US and this type of pattern usually leads to multiple Arctic air mass incursions into the northern US from northern Canada. In fact, this forecast map suggests that the upper-level winds at 500 millibars – which tend to follow the height anomaly lines - could actually bring air from right around the North Pole into the northern US later this month.

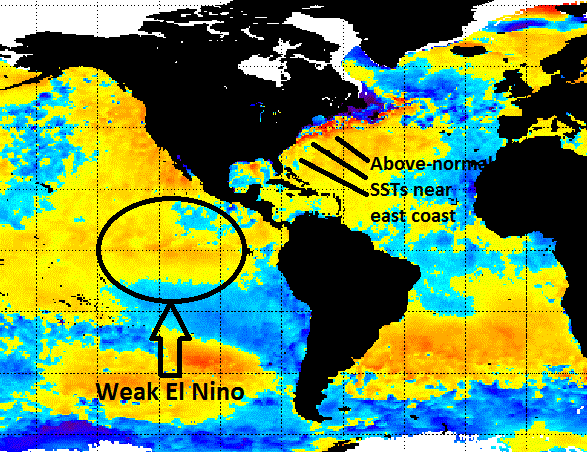
Snowfall and the connection to sea surface temperature (SST) anomalies Snow has been rather sporadic so far this winter in the Mid-Atlantic region, but two far apart sea surface temperature patterns suggest significant snow is still on the table for the second half of the winter season. First, the latest SST anomaly map (below) shows some well-above normal sea surface temperatures near the US east coast (reds, oranges, yellows). Historically, this type of pattern with warmer-than-normal water off the US east coast has been linked with above-normal snowfall in the Northeast US during the second half of the winter season. Warmer-than-normal water just off the US east coast in the wintertime tends to help increase the temperature gradient along the coastline, decrease the stability of the lower atmosphere, and, in general, helps to intensify coastal storms.

In addition, the latest SST anomaly pattern in the central Pacific Ocean features an El Nino (warmer-than-normal; yellows, oranges) and this has often been correlated with above-normal snowfall during the latter half of winter seasons in this part of the country. As an example, the El Nino winter of 1982-1983, which featured little snowfall during the first half of winter, produced a blockbuster snowstorm in the Northeast US during February of that particular winter.

SST [Current sea surface temperature anomaly chart; courtesy NOAA]
1:45 PM | *Deep freeze grips the nation as we close out 2014...brutal cold coming to central and eastern US next week*

Paul Dorian

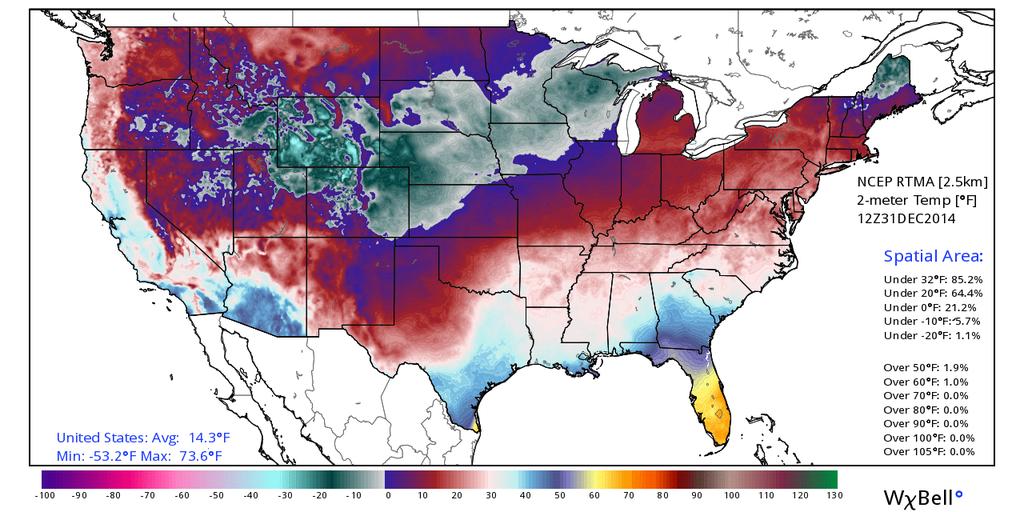
AM_nationwide_temps[7AM temperature map across the nation with average CONUS temperature of 14.3°F; map and data courtesy Ryan Maue of Weather Bell Analytics at "weatherbell.com"]
Discussion

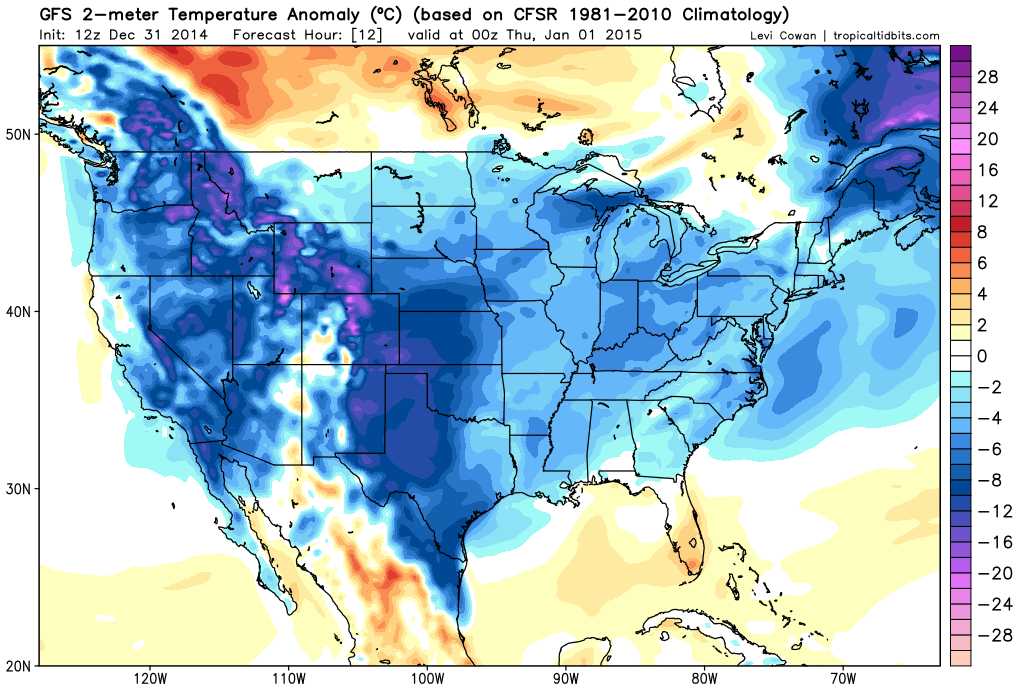
It is certainly not too unusual to have cold air across parts of the nation at the end of the month of December; however, today’s nationwide deep freeze is indeed quite impressive. First of all, the average temperature this morning across the Lower 48 bottomed out at 14.3°F (at 7am ET). This is the lowest reading during the month of December since December 23, 1998 – some 16 years ago (data and temperature map above courtesy Ryan Maue of Weather Bell Analytics at "weatherbell.com"). In addition, about 85% of the nation was below freezing as of 7am (ET) this morning. The 12-hour 2-meter temperature anomaly forecast map from this morning’s GFS model run shows almost all “blues and purples” across the nation representing all areas predicted to experience below-normal temperatures (forecast map below courtesy “tropicaltidbits.com”). The current deep freeze extends virtually from coast-to-coast with the only exception being the Florida Peninsula where temperatures will remain above-normal (oranges/yellows).

00Z_temp_anomalies [12Z GFS 2-meter temperature anomaly forecast map for early tonight; map courtesy "tropicaltidbits.com"]
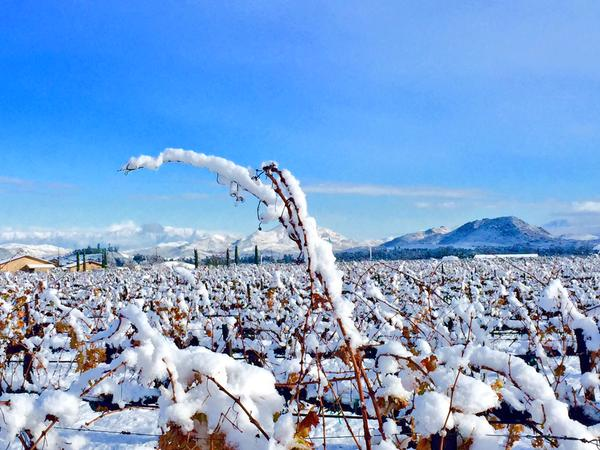
In addition to the widespread cold which has even extended into southern California, a rare snow is occurring today across the Southwest US at such locations as Lake Havasu, Arizona, Las Vegas, Nevada, and the southern California San Bernardino mountains. Today’s cold and snow is being fueled by intense upper-level low pressure over the Desert Southwest and a very strong Arctic high pressure system over the Northern Plains and Rockies.

Temecula_vineyard [Southern California (Temecula) vineyard in the deep freeze this morning]

Looking ahead to next week, after a brief spike in temperatures on Sunday across the east coast, colder air will again make a move from Canada into the northern US anchored by more strong high pressure. This time the cold air outbreak is likely to spare the western US, but by the second half of next week, the central and eastern US could be in the deep freeze once again and this time Florida may not be so lucky. Next week’s outbreak could very well cause a freeze problem way down the Florida Peninsula and places in the Upper Midwest like Chicago, Illinois could experience sub-zero temperatures.