
2:30 PM | Global sea ice areal extent running at slightly above-normal levels
Paul Dorian

[Yellow line represents the year-to-date Southern Hemisphere sea ice areal extent compared to all other years going back to 1979; data courtesy University of Illinois "cryosphere"; NOAA/NCEP Snow and Ice Data Center]
Discussion
Overall Summary
Southern Hemisphere sea ice areal extent continues to run near record high levels in the satellite data era (circled area above) for this time of year in records going back to 1979 whereas the Northern Hemisphere continues to run near record low levels in the same comparison time period (circled area on bottom plot). Overall, the global sea ice areal extent is currently running slightly above-normal at just under half a million square kilometers above the 1979-2008 mean (below).

[red line represents global sea ice areal extent compared to the 1979-2008 normal as represented by the “zero” line; data courtesy University of Illinois "cryosphere"; NOAA/NCEP Snow and Ice Data Center]
Southern Hemisphere Sea Ice
The rather remarkable period of consistently higher-than-normal sea ice areal extent in this part of the world actually began a few years ago. Back in 2011, the southern hemisphere sea ice areal extent was still at below-normal levels, but it has surged in recent years to the current 1.2 million square kilometers above the 1979-2008 mean.
Northern Hemisphere Sea Ice
The northern hemisphere sea ice areal extent is still below-normal relative to all years going back to 1979 although it is well above the lowest point set during 2012 and even above levels seen earlier this year. The northern hemisphere sea ice areal extent is currently 0.8 million square kilometers below-normal using the base period of 1979-2008 for comparison. The northern hemisphere sea ice areal extent has leveled off in the past 10 years or so at below-normal levels after dropping consistently from the mid 1990’s to the middle of the last decade. In the time period before the mid 1990’s, the sea ice areal extent was generally above-normal dating back to 1979.
The directional shift in the sea ice areal extent trendline that developed during the mid 1990’s in the northern hemisphere correlates quite well with a northern Atlantic Ocean sea surface temperature cycle that is tracked by meteorologists through an index called the Atlantic Multidecadal Oscillation (AMO). Indeed, Atlantic Ocean sea surface temperature anomalies play a critical role in the overall northern hemisphere sea ice areal extent. The AMO index flipped in phase during the mid 1990’s from negative (cold) to positive (warm) and the sea ice areal extent trendline changed direction right around that point in time.
The Atlantic Ocean is just recently showing signs of a long-term temperature phase shift back to cold and if that trend continues over the next couple of years then the northern hemisphere sea ice areal extent is quite likely to return to the above-normal levels seen prior to the mid 1990’s. (Click here for more information on the potential significant temperature phase shift in the Atlantic Ocean: http://vencoreweather.com/2015/03/22/1230-pm-the-atlantic-ocean-is-showing-signs-of-a-possible-significant-long-term-shift-in-temperatures-from-warm-to-cold/).

[Yellow line represents the year-to-date Northern Hemisphere sea ice areal extent compared to all other years going back to 1979; data courtesy University of Illinois "cryosphere"; NOAA/NCEP Snow and Ice Data Center]
Paul Dorian
Vencore, Inc.


 [12Z GFS 10-day forecast map for 500 millibar height anomalies (blues=low pressure trough, oranges=high pressure ridge); map courtesy "tropicaltidbits.com", NOAA]
 [12Z GFS 14-day forecast map for 2-meter temperature anomalies (blues=colder-than-normal, oranges=warmer-than-normal); map courtesy "tropicaltidbits.com", NOAA]
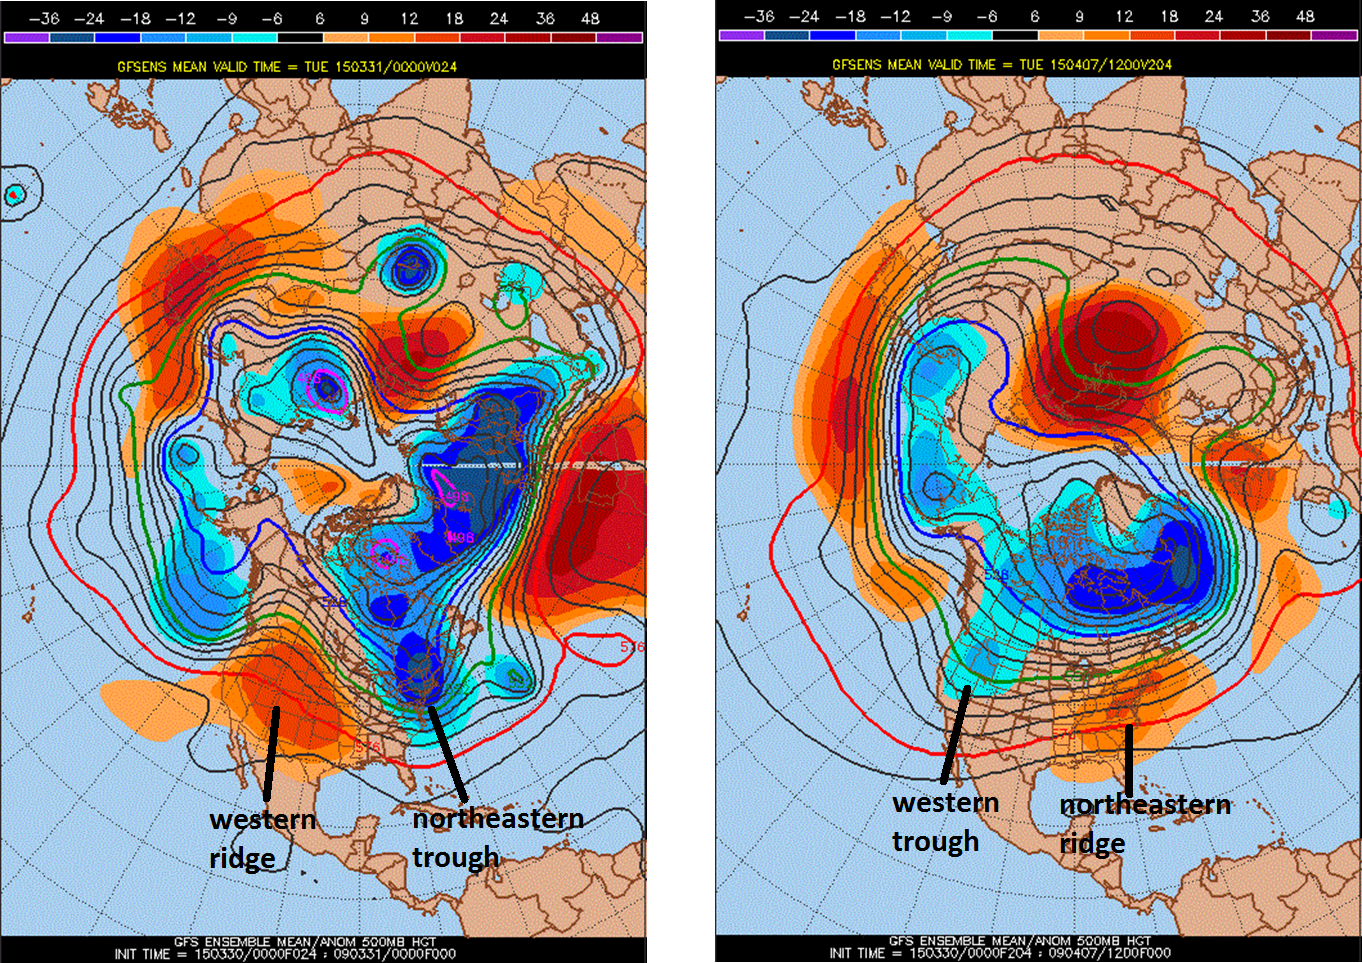 [00Z GFS Ensemble run forecast maps of 500 millibar height anomalies for tomorrow (left) and April 7th (right); map courtesy Penn State e-Wall, NOAA]
 [00Z Canadian model forecast map of 500 millibar height anomalies averaged out for the 7-10 day time period ending on April 7th; map courtesy Penn State e-Wall]
 [Tornado season is off to an historically low start through the first three months of the year; courtesy NOAA]


 [European model forecast of the MJO index through March 23rd; courtesy NOAA]
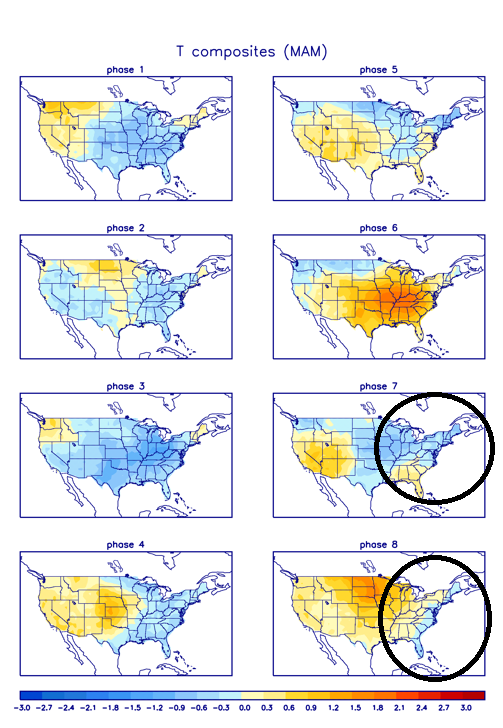 [US temperature anomalies for different phases of the MJO index during the period of March/April/May; courtesy NOAA]
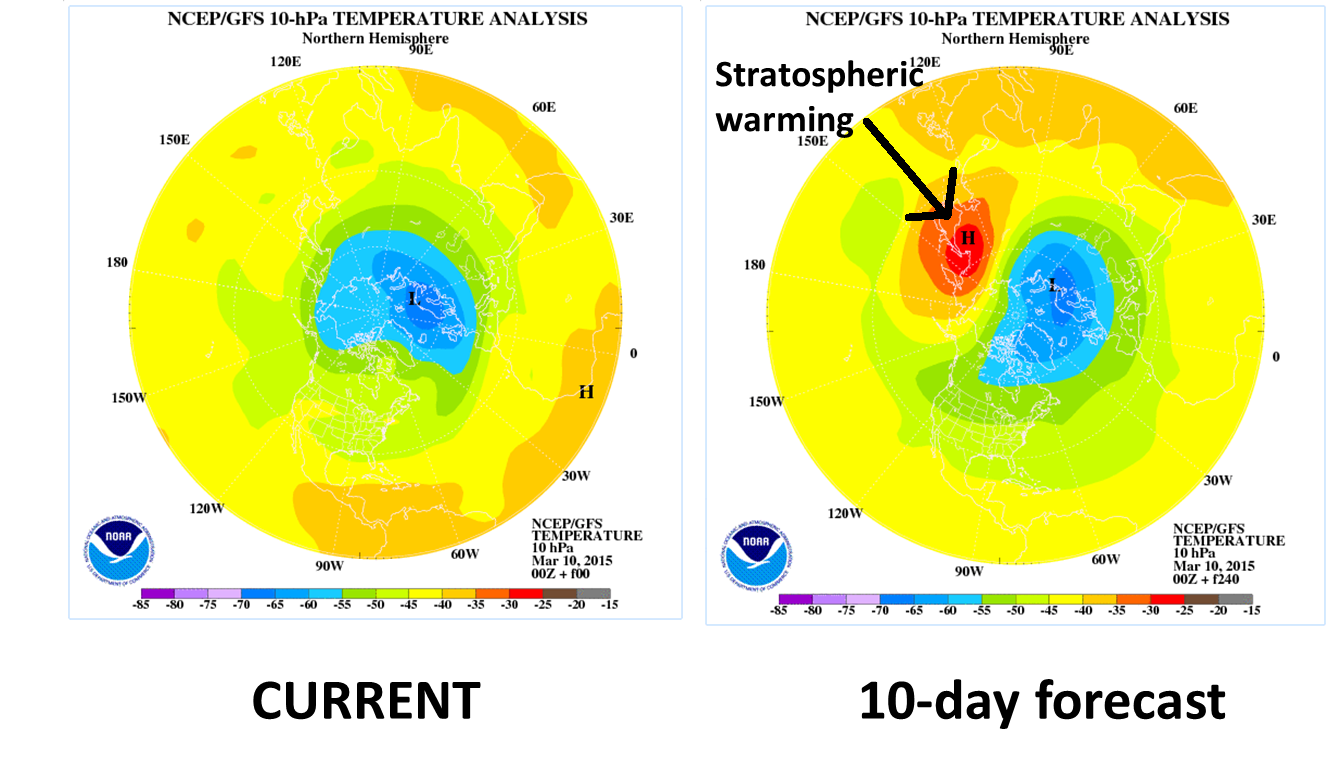 [Temperature analysis at 10 millibars (stratosphere), current and 10-day forecast; courtesy NOAA]
 [06Z GFS Ensemble 500 mb height anomaly forecast map for March 20th; map courtesy "tropicaltidbits.com", NOAA]
 [Observed (black) and forecast (red) of the Arctic Oscillation index; courtesy NOAA]
 [NOAA CFSv2 45-day temperature anomaly forecast; map courtesy Weather Bell Analytics at weatherbell.com, NOAA]
 [06Z GFS 500 millibar height anomaly forecast for March 6th; map courtesy "tropicaltidbits.com, NOAA]


 [Early morning NEXRAD radar image with snow over the Great Lakes/Ohio Valley and headed our way; image courtesy University of Wisconsin]