
1:00 PM (Wed.) | *A parade of tropical systems from the Caribbean Sea to Africa…"teleconnections", "climatology" support the idea of an active stretch into Sept…Gulf of Mexico likely impact zone*
Paul Dorian

Two tropical systems can be seen in the Atlantic Basin on the latest IR satellite image and a third wave is now situated over the west coast of Africa (circled regions). In addition, there is a fourth tropical wave now located over the central part of Africa. Image courtesy CIMSS/University of Wisconsin/NOAA
Overview
The 2020 Atlantic Basin tropical season has gotten off to a very busy start and a parade of systems is going to keep it busy right through the remainder of the month of August. There are currently two tropical systems in the Atlantic Basin which are being closely monitored and both are likely to reach tropical storm status in coming days. A third tropical wave has reached the west coast of Africa and it looks quite impressive on satellite imagery and there is yet another wave situated over the central part of Africa. A “teleconnection” index known as the Madden-Julian Oscillation (MJO) which tracks an eastward-moving tropical disturbance supports the idea for increased tropical activity as we progress through the rest of August. In addition, the latter part of August is from a “climatological” point-of-view, a time of year when tropical activity tends to ramp up as sea surface temperatures climb towards their peak supporting the formation and intensification of tropical cyclones in the Atlantic Basin.

The 00Z Euro computer forecast model depicts movement of the MJO teleconnection index into “phases” 1 and 2 in coming days and this usually often results in increased activity in the tropical Atlantic. Map courtesy NOAA, ECMWF
Madden-Julian Oscillation (MJO) teleconnection index
The MJO teleconnection index tracks a tropical disturbance that propagates eastward around the global tropics with a cycle on the order of 30-60 days. The MJO is often quite variable, with periods of moderate-to-strong activity followed by periods of little or no activity. The MJO influences tropical cyclone activity in both the eastern Pacific and in the Atlantic Basin during the Northern Hemisphere summer. Research has found that the location of the MJO, or “phase”, is linked with certain temperature and precipitation patterns around the world.

“Composite” maps of sea level pressure anomalies are shown here based on numerous events for the eight different “phases” of the Madden-Julian Oscillation (MJO). The boxed-in regions of phases 1 (bottom) and 2 (top) suggest lower-than-normal sea level pressure is typical in the Gulf of Mexico region and Caribbean Sea during this time of year - all suggestive of increased tropical activity. Map courtesy NOAA
The very latest MJO forecast from the European model propagates the index into “phases” 1 and 2 during the next couple of weeks and this tends to favor increased tropical activity in the Atlantic Basin. “Composite” maps for different MJO “phases” have been produced for a variety of parameters by combining many MJO events and they can often provide a clue as to what to expect in coming days across the tropics. One such parameter – sea level pressure anomalies – suggests that there can be increased tropical activity in the Gulf of Mexico region and the Caribbean Sea as the MJO index enters into “phases” 1 and 2 (i.e., lower than normal pressures in those regions).
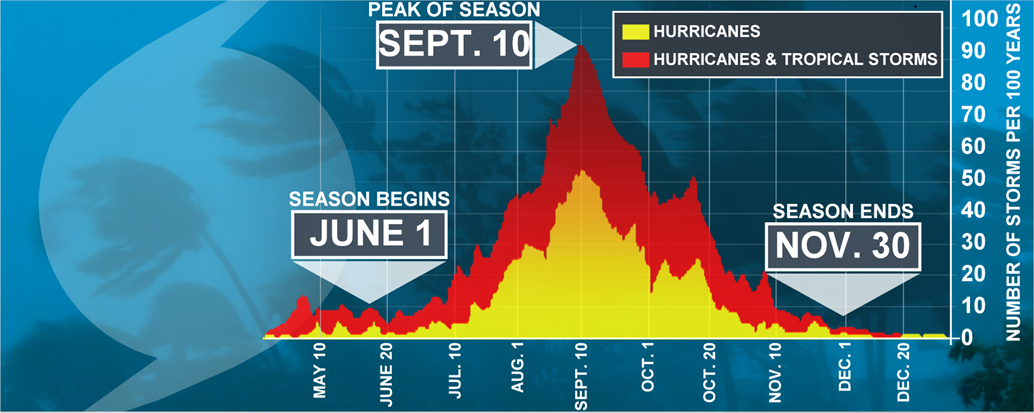
The climatological peak of the Atlantic Basin tropical season takes place around the middle of September largely as a result of a corresponding peak in Atlantic Ocean sea surface temperatures. Map courtesy NOAA.
Climatology
Sea surface temperatures are crucial in the formation and potential intensification of tropical cyclones in the Atlantic Basin and they tend to reach their peak during the latter part of August or the first half of September. Current sea surface temperatures are plenty sufficient in the tropical Atlantic to support the generation and intensification of tropical cyclones with > 30° C in many areas. Typically, tropical activity ramps up during the latter stages of August and reaches a peak in mid-September and this is well-correlated with the sea surface temperature pattern.

The “official” locations of three tropical waves as depicted by NOAA’s National Hurricane Center. Map courtesy NOAA
Current tropical activity
Wave #1
One tropical wave in a series of waves has already pushed over the eastern Caribbean Sea and it is likely to intensify over the next several days as it continues on a general west-to-northwest track. This type of track could result in movement of this initial wave to the Yucatan Peninsula region of Mexico by later this weekend or early next week and it could then spill out over the southwestern part of the Gulf of Mexico.
Wave #2
A second system is currently located over the central tropical Atlantic and it is producing a concentrated area of showers and thunderstorms. This system which is also moving along on a west-to-northwest track is very likely to intensify into tropical storm status in coming days as it churns over very warm waters of the tropical Atlantic. Its ultimate track may be just to the north of the initial wave now over the Caribbean, but its ultimate path may also be right towards the (eastern/central) Gulf of Mexico. This system is especially concerning as it will remain over water for a lengthy time which will no doubt aid in its intensification prospects.
Wave #3
A third tropical wave can be seen on satellite imagery over the west coast of Africa and this is a possible longer-term threat; especially, when factoring in the model predicted trend of the Madden-Julian Oscillation index which suggests that there will favorable environmental conditions in the tropical Atlantic as we progress through the remainder of the month of August.
Wave #4
Yet another tropical wave - the fourth in a parade of tropical waves - is located over the central part of Africa and it too may become a player over the next couple of weeks as it pushes to the west riding along in the trade winds.

Strong high pressure in the upper part of the atmosphere will be situated over the western Atlantic Ocean by later in the weekend according to the 00Z Euro. Clockwise winds around the high pressure system will likely push tropical systems in a general east-to-west fashion - towards the Gulf of Mexico region from Florida to Texas. Map courtesy, WSI, Inc., ECMWF
Key role of upper-level pattern in storm tracks
One key factor in the movement of all of these tropical systems will be the unfolding upper air over the eastern US and western Atlantic. All signs point to a strengthening high pressure ridge over the western Atlantic that very well could result in “southern” tracks for these tropical systems given the clockwise movement of air. This type of developing upper air pattern suggests that the main area of concern for impact in the US in coming days could be the Gulf of Mexico region from Florida to Texas.
Bottom Line
There are currently as many as four tropical waves extending from the Caribbean Sea to the central part of Africa - all promising an active stretch in coming days. In addition, climatology favors an increase in tropical activity in the Atlantic Basin this time of year as sea surface temperatures climb towards their peak and the expected trend of the MJO “teleconnection” index also favors an increase in tropical activity as it enters into favorable “phases”. Buckle up.
Meteorologist Paul Dorian
Perspecta, Inc.
perspectaweather.com
Follow us on Facebook, Twitter, YouTube
Video discussion: