12:40 PM (Thursday) | ***Two tropical depressions in the Atlantic Basin with the Gulf of Mexico in the likely high impact zone by early-to-mid next week***
Paul Dorian

The latest GOES-16 satellite imagery features two tropical depressions and a third wave near the west coast of Africa. Images courtesy NOAA, College of DuPage
Overview
The 2020 Atlantic Basin tropical season has gotten off to a very busy start and a parade of systems is going to keep it busy right through the remainder of August. There are now two tropical depressions in the Atlantic Basin which are likely to reach tropical storm status in coming days with the Gulf of Mexico the likely high impact zone by the early or middle of next week. A third tropical wave has reached the west coast of Africa and there is yet another wave situated over the central part of Africa. A “teleconnection” index known as the Madden-Julian Oscillation (MJO) which tracks an eastward-moving tropical disturbance supports the idea for increased tropical activity over the next couple of week. In addition, the latter part of August is a time of year when tropical activity tends to ramp up as sea surface temperatures climb towards their peak supporting the formation and intensification of tropical cyclones in the Atlantic Basin.

The 00Z Euro computer forecast model depicts movement of the MJO teleconnection index into “phases” 1 and 2 in coming days and this usually often results in increased activity in the tropical Atlantic. Map courtesy NOAA, ECMWF
Madden-Julian Oscillation (MJO)
The MJO teleconnection index tracks a tropical disturbance that propagates eastward around the global tropics with a cycle on the order of 30-60 days. The MJO is often quite variable, with periods of moderate-to-strong activity followed by periods of little or no activity. The MJO influences tropical cyclone activity in both the eastern Pacific and in the Atlantic Basin during the Northern Hemisphere summer. Research has found that the location of the MJO, or “phase”, is linked with certain temperature and precipitation patterns around the world.

“Composite” maps of sea level pressure anomalies are shown here based on numerous events for the eight different “phases” of the Madden-Julian Oscillation (MJO). The boxed-in regions of phases 1 (bottom) and 2 (top) suggest lower-than-normal sea level pressure is typical in the Gulf of Mexico region and Caribbean Sea during this time of year - all suggestive of increased tropical activity. Map courtesy NOAA
The very latest MJO forecast from the European model propagates the index into “phases” 1 and 2 during the next couple of weeks and this tends to favor increased tropical activity in the Atlantic Basin and, specifically, in and around the Gulf of Mexico. “Composite” maps for different MJO “phases” have been produced for a variety of parameters by combining many MJO events and they can often provide a clue as to what to expect in coming days across the tropics. One such parameter – sea level pressure anomalies – suggests that there can be increased tropical activity in the Gulf of Mexico and the Caribbean Sea as the MJO index enters into “phases” 1 and 2 (i.e., lower than normal pressures in those regions).

Tropical activity in the Atlantic Basin normally ramps up this time of year as sea surface temperatures reach their peak with many areas in the Gulf of Mexico currently at or above 30 degrees C. Map courtesy NOAA, tropicaltidbits.com
Sea surface temperatures
Sea surface temperatures are crucial in both the formation and intensification of tropical cyclones in the Atlantic Basin and they tend to reach their peak during the latter part of August or the first half of September. Typically, tropical activity ramps up during the latter stages of August and reaches a peak in mid-September and this is largely due to the correlation with the sea surface temperatures. In fact, about 2/3rds of all Atlantic Basin hurricane activity occurs between August 20th and October 10th. Current sea surface temperatures are plenty sufficient in the tropical Atlantic to support the generation and intensification of tropical cyclones with much of the Gulf of Mexico experiencing > 30° C.

Strong high pressure over the western Atlantic will be a key player in the movement of these two tropical depressions in coming days and the upper-level trough over the south-central US/Gulf of Mexico will also play a role. Map courtesy WSI, Inc, ECMWF (500 mb forecast map from the 00Z Euro for Saturday evening).
Current tropical activity
Tropical Depression #14 (Caribbean Sea)
Tropical Depression #14 is located over the central Caribbean Sea and moving westerly at 21 mph with maximum sustained winds of 35 mph. The latest satellite imagery indicates that the overall circulation field is becoming better organized and convection has increased in intensity and attaining named tropical storm status may not be far away. It is currently under the influence of a Bermuda high pressure system that is steering it to the west, but ultimately, an upper-level trough over the Gulf of Mexico may become the dominant player in its storm track. As such, it is likely to head to the Yucatan Peninsula region of Mexico over the weekend and then take a turn more to the west-northwest and northwest and also it’ll tend to slow down some which will allow for additional intensification. Beyond that, this system should spill out over the southwestern part of the Gulf of Mexico and perhaps then heads towards the Texas and/or Louisiana coastal regions.
Tropical Depression #13 (Central Atlantic)
A second tropical depression is system is currently located over the central tropical Atlantic and is moving WNW at 21 mph with maximum sustained winds of 35 mph. This system is going to be under the influence of strong high pressure ridging strengthening over the central Atlantic in coming days and its track could take it over the Bahama Islands and towards the Straits of Florida by the early part of next week. As with tropical depression #14, environmental conditions should become favorable for intensification and a likely attainment of named tropical storm status.
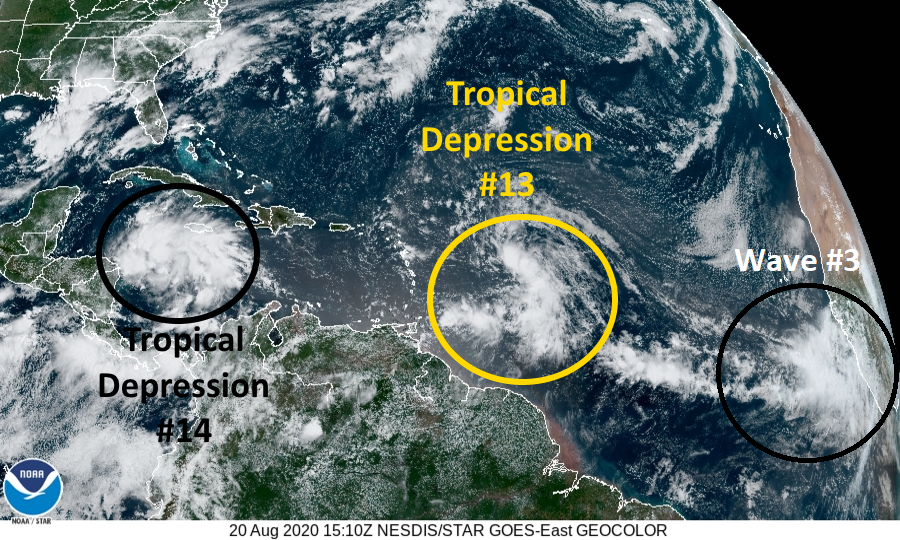
The two tropical depressions (#13, #14) in the Atlantic Basin and the third tropical wave are circled in this most recent GOES-16 satellite image. Image courtesy NOAA
Waves 3 and 4 (Africa)
A third tropical wave can be seen on satellite imagery near the west coast of Africa and this is a possible longer-term threat that will have to be closely monitored; especially, when factoring in the favorable model predicted trend of the Madden-Julian Oscillation which suggests increased activity. Yet another tropical wave - the fourth in a parade of tropical systems - is located over the central part of Africa and it too may become a player over the next couple of weeks as it pushes to the west riding along on the trade winds.

The latest storm track predictions from NOAA’s National Hurricane Centerare shown here and the Gulf of Mexico region from Florida-to-Texas is a potential high impact area in coming days. Map courtesy NOAA
Concluding remarks
It is too early to say which of these two tropical depressions will become the first newly named tropical storm, but whichever is first would become “Laura” and the second one would become “Marco”. The record for the earliest named “L” storm in the Atlantic Basin is “Luis” on August 29, 1995. It is certainly on the table that both of these systems will be over the Gulf of Mexico at the same time during the early-to-middle parts of next week. According to Philip Klotzbach of Colorado State University, the most Atlantic Basin named storms to make landfall in the continental US (CONUS) by the end of August is six which happened in 1886 and 1916. This year the CONUS has already had five landfalling named systems: Bertha, Cristobal, Fay, Hanna and Isaias. While only two of the landfalling systems this year have been at hurricane strength (Hanna, Isaias), five of the six named storms that made landfall by the end of August in 1886 did so at hurricane strength, including the especially devastating Category 4 “Indianola” hurricane which was one of the most intense ever to strike the US.
Buckle up…the rest of August and at least the first part of September will be an active period in the tropical Atlantic Basin. A teleconnection index known as the Madden-Julian Oscillation (MJO) and sea surface temperature patterns support the idea of an active few weeks in the Atlantic Basin and, specifically, in the Gulf of Mexico region. Of immediate concern for potential high impact in the US will be the entire Gulf of Mexico region from Florida-to-Texas. An initial tropical depression is likely to cross Yucatan Peninsula region of Mexico and then push into the western Gulf of Mexico with perhaps an ultimate impact on Texas and/or Louisiana coastal regions by the early or middle parts of next week. A second tropical depression is likely to take a track towards the Florida Straits with possible high impact on the Florida Peninsula by the early or middle parts of next week.
Meteorologist Paul Dorian
Perspecta, Inc.
perspectaweather.com
Follow us on Facebook, Twitter, YouTube
Video discussion: