*2026-2027 Winter Outlook by Arcfield Weather*
Paul Dorian
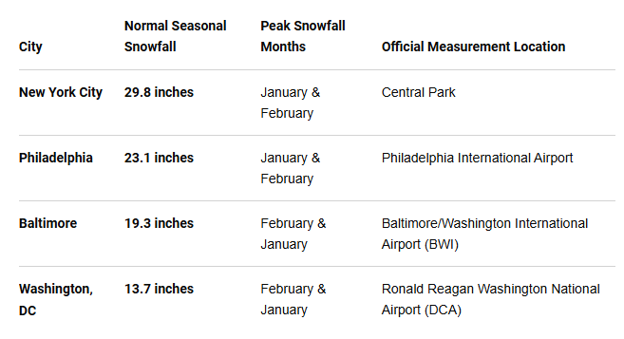
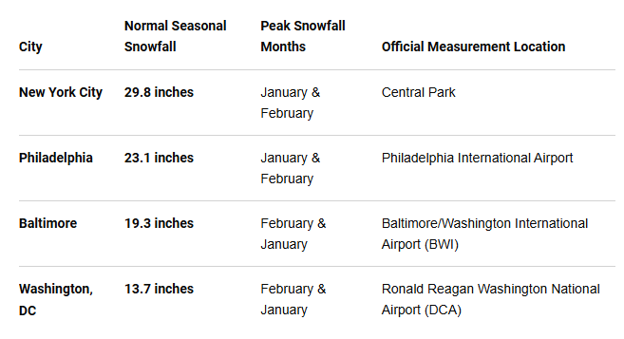
Normal Seasonal Snowfall for the Mid-Atlantic’s I-95 Corridor
Overview
A very strong El Nino event will be one of the key players this upcoming winter season with warmer-than-normal water temperatures in the equatorial part of the Pacific Ocean likely to last all the way into next spring. Other factors include a positive (westerly) Quasi-Biennial Oscillation, negative Pacific Decadal Oscillation, and somewhat favorable prospects for a “polar vortex disruption” and “stratospheric warming”; especially, during the second half of the winter. By pumping massive amounts of heat and moisture in the atmosphere, a very strong El Nino typically amps up the sub-tropical (southern) branch of the jet stream and an overall stormy weather pattern is likely to be the result from coast-to-coast. There is the potential for numerous storm systems to travel from California to across the southern states and then potentially, ride up near or along the US east coast.
Temperatures are often warmer-than-normal across the northern US during a very strong El Nino winter season and colder-than-normal conditions are typical in many of the southern states. In the Mid-Atlantic region, despite the possibility of an overall slightly warmer-than-normal winter season, there can be above-normal snowfall amounts given the idea that we may be dealing with numerous storm systems in the eastern states...one or two of which can become blockbuster snowstorms. All it takes is for one or two of these storm systems to team up with an Arctic air outbreak and above-normal seasonal snowfall amounts can take place in a hurry...and this prospect exists in the Mid-Atlantic region including along the DC-to-Philly-to-NYC corridor.
Highlights
Some of the highlights of this year’s Winter Outlook are listed below:
1. Very strong El Nino conditions in the tropical Pacific Ocean are expected to last all the way into spring 2027
a. An activated sub-tropical (southern) jet stream
b. stormy pattern from coast-to-coast
c. above normal snowfall Appalachian Mountains; below-normal “lake-effect” snow downstream of the Great Lakes
d. blockbuster snowstorm or two possible in Mid-Atlantic/Northeast US
2. Favorable signals for polar vortex disruption and stratospheric warming
a. Strong El Nino combined with +QBO (favorable)
b. computer model forecasts of 10 mb winds (favorable)
3. “Back-loaded” winter across the Eastern US to follow a warm December
4. Analog years featuring strong El Nino winters are listed below and suggest warmer-than-normal conditions across much of the northern US and colder-than-normal weather across much of the southern US:
a. 1957-1958, 1965-1966, 1972-1973, 1982-1983, 1991-1992, 1997-1998, 2015-2016, 2023-2024
5. Strong El Nino, -PDO and +QBO...a rare combination which complicates the seasonal forecast
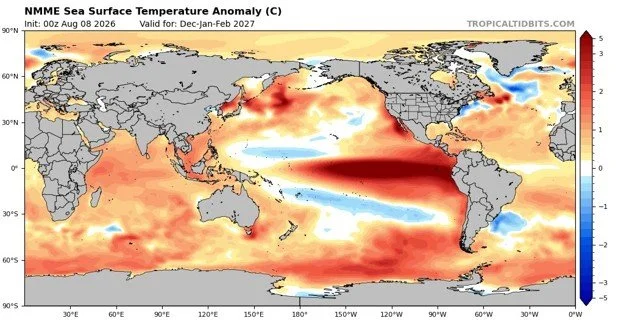
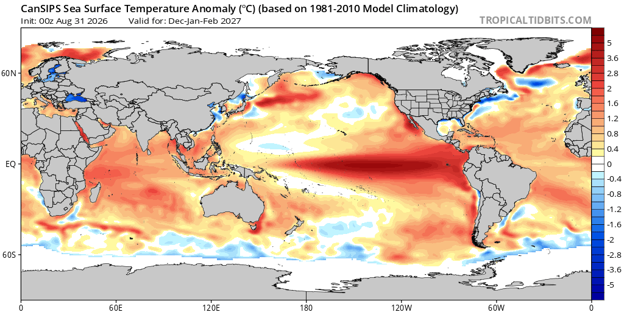
Two independent computer forecast models shown here favor the idea of a strong El Nino event continuing right through the upcoming winter season. Maps courtesy NOAA (North American Multi-Model Ensemble (NMME), top), Canadian Met Centre (Canadian Seasonal to Interannual Prediction System (CanSIPS), bottom).
Very strong El Nino
A very strong El Nino event is well underway in the tropical Pacific Ocean, and it will play a vital role in the weather across the continental US during this winter season. Very strong El Nino events were taking place on average about once a decade in the latter part of last century (1972-1973, 1982-1983, 1997-1998); however, the first decade of this century did not feature such a comparable episode. Instead, there were three moderate El Nino events to begin the 21st Century (2002-2003, 2006-2007 and 2009-2010) and the first very strong El Nino episode took place in 2015-2016.
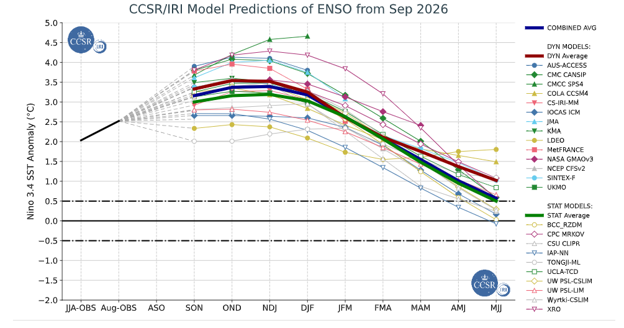
A compilation of computer forecast models indicate the peak of El Nino in Region 3.4 (central Pacific) may not come until the November/December time frame. Plot courtesy NOAA, ECMWF, JAM, Canadian Met Centre, CCSR/IRI
The current El Nino began during the spring of this year and followed the La Nina conditions of last winter. In fact, five of the last six winters have featured La Nina conditions in the tropical Pacific (i.e., colder-than-normal water temperatures). This current El Nino event is likely to peak during the November-to-December period and remain quite strong right through the upcoming winter season. It will end up being comparable in magnitude to some of the great episodes experienced during the last fifty years including those that took place in 1982-1983, 1997-1998, and 2015-2016.
A very strong El Nino during the winter season typically increases the intensity of the sub-tropical (southern) branch of the jet stream by pumping into the upper atmosphere enhanced amounts of heat and moisture that will be transported from the Pacific to the continental US. The southern branch of the jet stream is crucial for the development of storms in the eastern Pacific Ocean which can then travel from California to the southeastern US and then potentially, right up along or near the US east coast. Despite often being associated with overall warmer-than-normal conditions, very strong El Nino winters have featured some blockbuster snowstorms for the Mid-Atlantic region including in the big cities along the I-95 corridor. One such example took place in February 1983, which at the time, became the biggest snowstorm ever observed in Philly (bested later by the January 1996 storm). A second example of a blockbuster snowstorm during a very strong El Nino winter took place more recently during late part of January 2016. In fact, this was the last snowstorm that produced about 2 feet of snow all along the DC-to-Philly-to-NYC corridor.
Warmer-than-normal water across much of the northern Pacific and Atlantic; “sliver” of colder-than-normal water off Mid-Atlantic/NE US coastlines
El Nino is not the only game in town as far as the winter outlook is concerned and it is useful to look in other areas as well. Other regions of note include the northern Pacific Ocean with widespread warmer-than-normal sea surface temperatures and much of the Atlantic Ocean as well. One of exceptions to the warmer-than-normal pattern in the Atlantic Ocean is the area just off the Northeast US coastline where a “sliver” of colder-than-normal water looks to be quite likely this winter. The two independently-made sea surface temperature anomaly model forecasts made for the upcoming winter season (above) tend to agree on the major player – El Nino - across the Pacific Ocean and they tend to also agree on the northern Pacific (warmer-than-normal), Atlantic (warmer-than-normal), and coastal waters of the Northeast US (colder-than-normal).
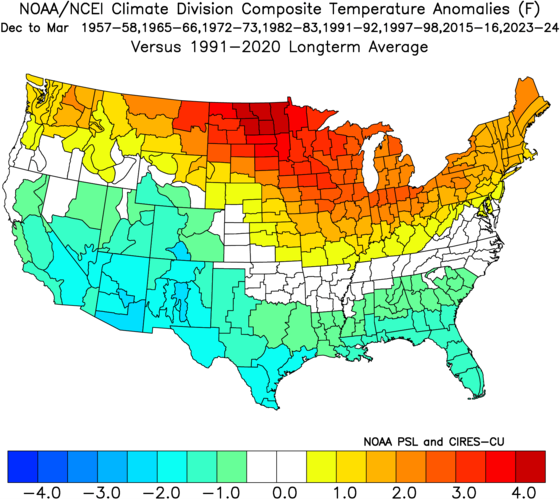
Average December to March temperature anomaly pattern for the analog years; courtesy NOAA
Analog years featuring very strong El Nino winters
While sea surface temperatures never repeat exactly from one year to another, it is still quite useful for long-range forecasting purposes to find analog years in which there are somewhat similar oceanic patterns to current (and near-term forecasted) conditions. In this case, that would mean a search for years in which there were strong-to-very strong El Nino events in the tropical Pacific Ocean during the winter seasons. Indeed, I believe the winter seasons of 1957-1958, 1965-1966, 1972-1973, 1982-1983, 1991-1992, 1997-1998, 2015-2016, 2023-2024 featured somewhat analogous sea surface temperature patterns compared to today’s environment and their average temperature and precipitation patterns during the winter seasons can provide us with a clue as to what we can expect.
These analog years featured winter seasons in which overall average temperatures were above-normal across the northern US and below-normal in southern areas of the US. The Mid-Atlantic region was sandwiched between these two zones with near normal to slightly above normal conditions on average during these strong El Nino analog years.
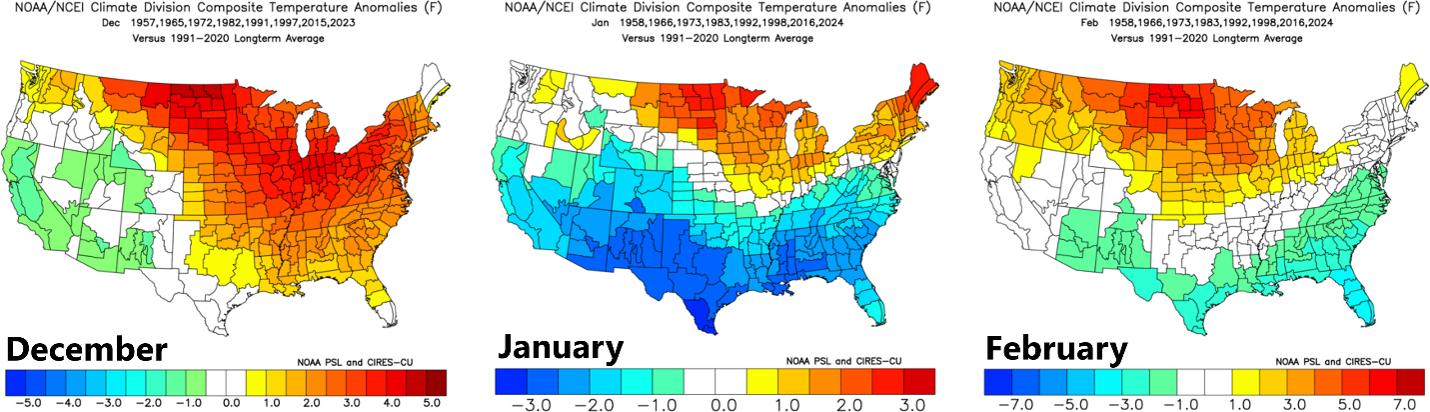
Month-to-month breakdown of temperature anomalies during the analog years; courtesy NOAA
An interesting finding with respect to temperatures in these selected analog years is revealed when looking at the breakdown of anomalies on a month-to-month basis. There was a clear tendency for the eastern two/thirds of the nation to experience a much warmer-than-normal start to the winter during the month of December, and then colder-than-normal conditions dominated the southern states and parts of the Mid-Atlantic region during January and February.
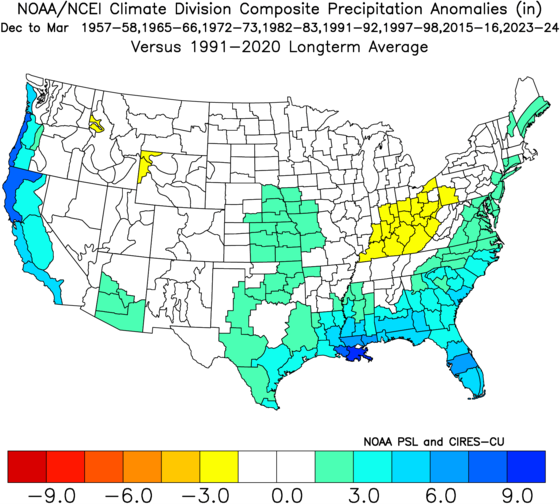
Average December to March precipitation anomaly pattern for the analog years; courtesy NOAA
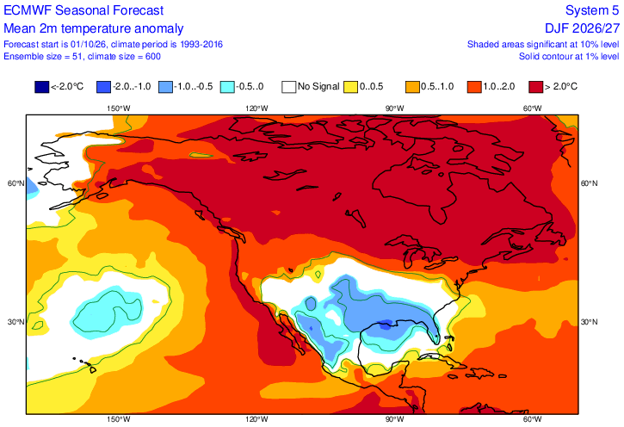
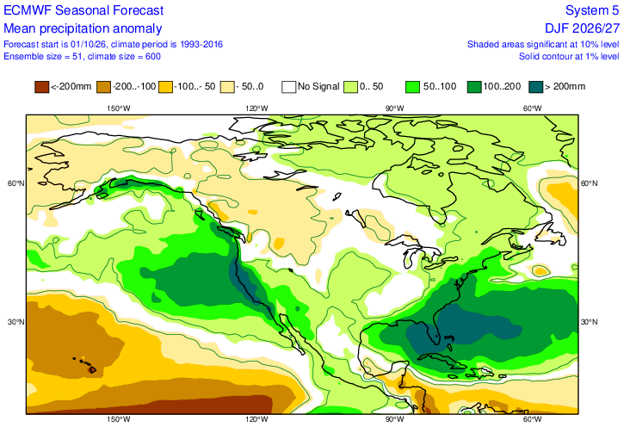
There are many similarities between the averages from my selected analog years for the winter season and the latest Euro model seasonal forecast for 2-meter temperature (top) and precipitation anomaly (bottom) across the continental US. Maps courtesy ECMWF
As far as precipitation is concerned, these selected analog years featured on average wetter-than-normal conditions in the Deep South, central states, and along much of both coastlines. As with temperatures, this is a somewhat typical pattern seen during winter seasons in strong El Nino years and is reflective of the “pumped up” southern branch of the jet stream that can bring storms from California across the southern states to the southeast US and then potentially, up along or near the eastern seaboard.
Polar vortex disruption and sudden stratospheric warming
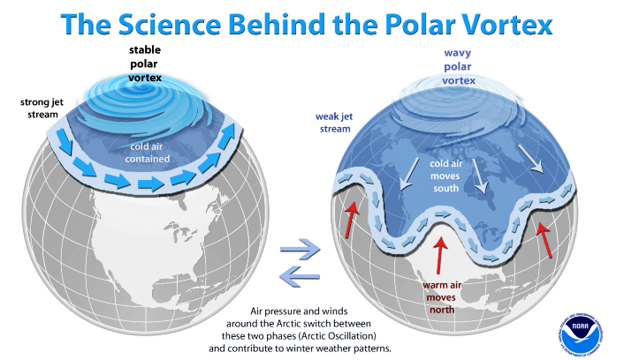
In addition to the analysis of sea surface temperature anomalies and comparisons with analog years, I find it useful in the long-range forecasting of winter weather to evaluate the prospects for “polar vortex disruption” and “sudden stratospheric warming” events which can unleash Arctic air from the northern latitudes into the middle latitudes. Two factors this year that can have an impact on the polar vortex and stratospheric temperatures include the strong El Nino in the tropical Pacific, and a positive (westerly) Quasi-Biennial Oscillation or QBO. The Pacific Decadal Oscillation (PDO) has been in a persistently negative phase and the combination of +QBO, -PDO, and a very strong El Nino is quite rare and complicates the seasonal forecast.
El Nino and the connection to the polar vortex
Very strong El Nino conditions are expected to last through the upcoming winter season, and we know from historical observations that El Nino Southern Oscillation (ENSO) drives “teleconnections” which are significant relationships or links between weather phenomena at widely separated locations on earth sometimes spanning thousands of miles. On average, El Nino teleconnections tend to amplify more waves into the stratosphere, and those waves weaken wintertime polar vortex winds on average compared to La Nina. One recent publication concludes there is an approximate 30% increase in sudden stratospheric warmings during El Nino winters [Polvani et al. 2017].
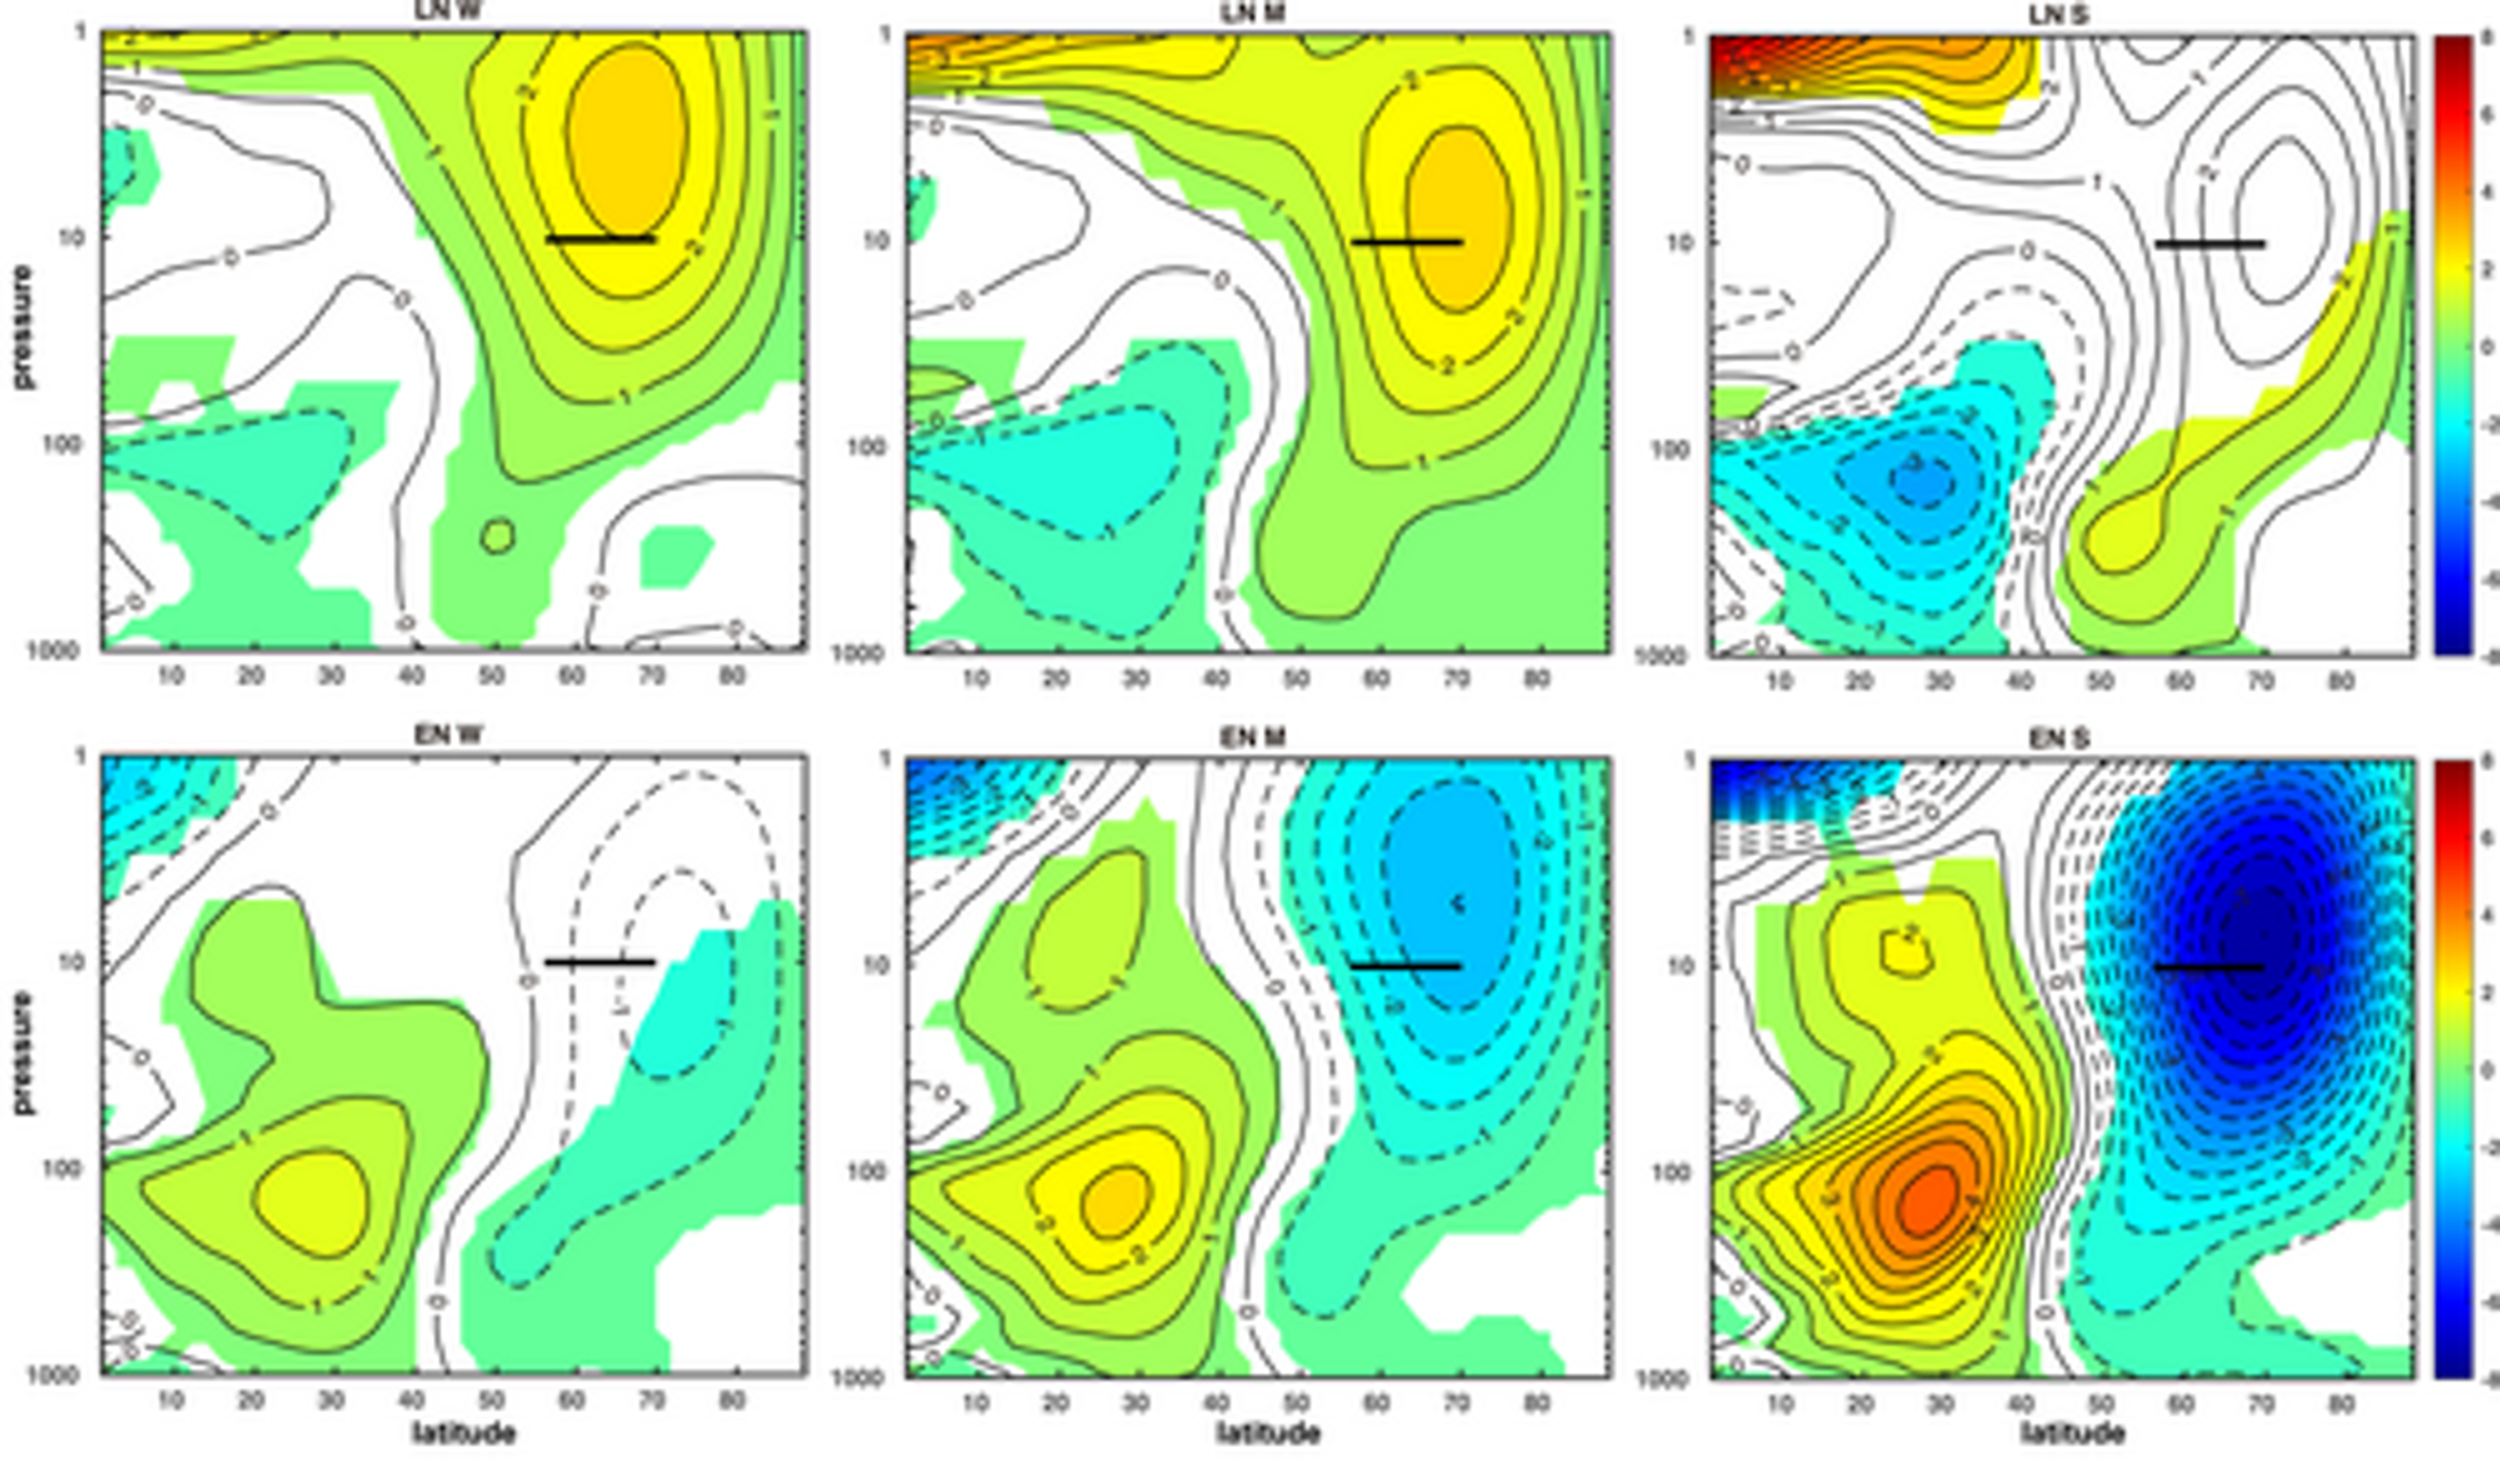
Zonal mean winds slow down over the stratospheric polar region with strong El Nino (dark blue, lower right panel) and increase over the middle atmosphere over the middle latitudes (orange). Publication entitled “Nonlinearity and Asymmetry of the ENSO Stratospheric Pathway to North Atlantic and Europe, Revisited” by E. Manzini, B. Ayarzaguene, N. Calvo, and D. Matei (January 2024).
Another recent publication presented evidence for a connection between El Nino Southern Oscillation (ENSO) and the stratosphere over the polar region during the Northern Hemisphere winter season. This paper presented a winter simulation that compared the impact on the polar vortex by La Nina (LN) and El Nino (EN) across different strengths: weak (W), moderate (M), and strong (S). It was found that a strong El Nino can indeed contribute to a significant stratospheric deceleration (weakening) of the polar vortex which can, in turn, unleash Arctic air masses from the high latitudes to the middle latitudes.
+Quasi Biennial Oscillation (QBO) and the connection to the polar vortex
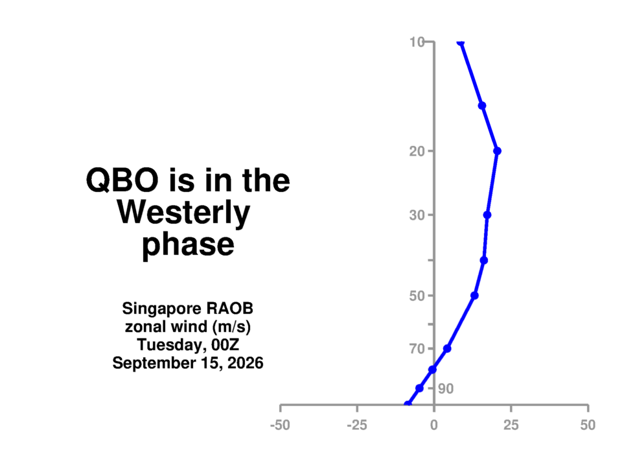
An atmospheric phenomenon known as the “Quasi-Biennial Oscillation” (QBO) is a changing wind anomaly in the tropical lower stratosphere. It has been found that strong stratospheric winds along an equatorial belt tend to completely change direction about every 14 months or so and this oscillation appears to play a crucial role in seasonal weather patterns as it can impact the polar vortex and the overall jet stream. Specifically, the tropical lower stratosphere winds flip from west-to-east or east-to-west every 14 months or so, an average period of about 28 months to return to the starting state. Currently, the QBO is in what is known as a “positive” or westerly phase. Recent upper air observations from NASA radiosondes suggest the “positive” (westerly) QBO phase will likely dominate during this upcoming winter season.
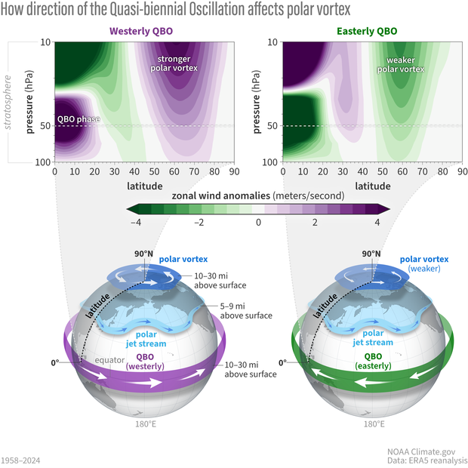
Effects of the QBO include mixing of stratospheric ozone by the secondary circulation caused by the QBO, modification of monsoonal precipitation, and an influence on stratospheric circulation in northern hemisphere winters (i.e., an impact on the frequency of sudden stratospheric warming (SSW) events and the disruption of the polar vortex). We tend to see weaker polar vortex winds and increased chances for sudden warmings during “easterly QBO” and stronger polar vortex winds and reduced chances of sudden warmings during “westerly QBO”.
Having said that, the QBO’s exact influence depends on outside forcing, such as El Nino Southern Oscillation (ENSO). In other words, a west or “positive” QBO will impact the Polar Vortex differently depending on the ENSO state: El Nino or La Nina. During a westward or “positive” phase of the QBO, there are often mild winters in northern Europe and the eastern US. However, according to historical data, +QBO in combination with El Nino yields a 62% chance that the polar vortex sees a major disruption known as a Sudden Stratospheric Warming (SSW) events (Source: https://www.climate.gov/media/16687 ). These SSW events and the disruption of the polar vortex in the northern hemisphere have the unique ability to discharge Arctic air into the middle latitudes from high latitudes.
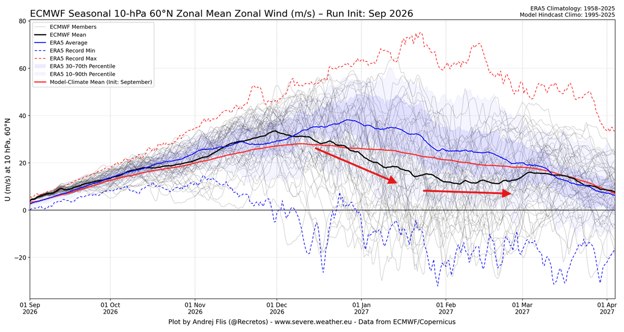
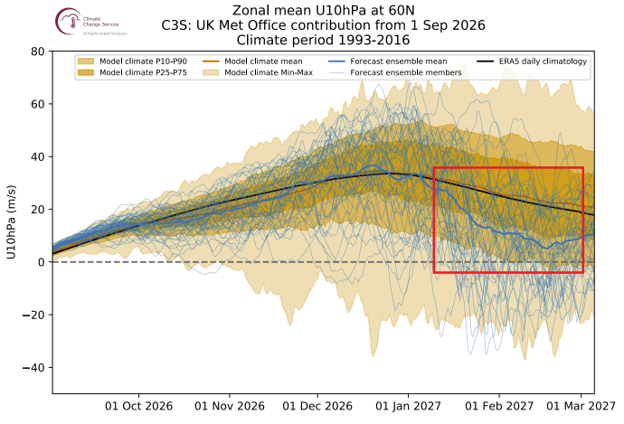
A recent European model run (top) predicts a weakening polar vortex as the winter progresses into January and February 2027. The forecast line (black) in the Euro model goes far below the long-term average line (blue) and the model’s own normal (red). The Euro is not the only model predicting a potential polar vortex disruption. The UKMET (bottom) also features weakening stratospheric winds as the winter season progresses into January and February.
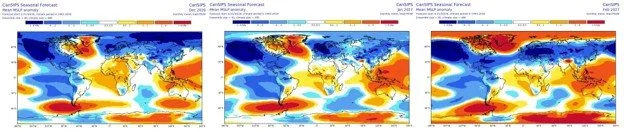
In addition to the ECMWF and UKMET forecasts for late winter weakening of the polar vortex, there is support from the Canadian model for late winter “high-latitude blocking” with stronger high pressure over places like Greenland and northeastern Canada as the winter progresses. Maps courtesy Canadian Met Centre
The bottom-line
Given the expected sea surface temperature patterns around the world for this winter season including that of a very strong El Nino in the tropical Pacific, I believe there is a likelihood for an amplified sub-tropical branch of the jet stream which, in turn, will fuel an overall stormy weather pattern across the continental US.
In terms of temperatures, analog year comparisons with other very strong El Nino winter seasons suggest warmer-than-normal conditions across much of the northern US and colder-than-normal weather across the southern states. The Mid-Atlantic region is likely to experience slightly above normal overall temperatures, but the somewhat favorable prospects for “polar vortex disruptions” and “Sudden Stratospheric Warming” suggests there can be Arctic air outbreaks to deal with; especially, during the second half of the winter. Winter is likely to get off to a warm start across the eastern two/thirds of the nation but can then turn significantly colder-than-normal across the southern states during January and February and close-to-normal in the Mid-Atlantic region.
In terms of precipitation, amplification of the southern branch of the jet stream is likely to result in numerous storm systems riding into California from the eastern Pacific Ocean and then to the southeastern US and potentially, up along or near the Atlantic seaboard. This storm track would result in heavy precipitation across the western US (rain for low-lying areas, snow in higher elevations), the southern Plains, and the Lower Mississippi Valley/Southeast US. Above-normal snowfall is likely this winter across much of the Appalachian Mountain chain all the way from the Tennessee Valley to New England, portions of the Deep South including the Gulf coast, and along the Mid-Atlantic’s I-95 corridor. “Lake-effect” snowfall just downstream of the Great Lakes are likely to be below-normal this winter season given the expected overall warmer-than-normal conditions and reduced temperature contrast with the water temperatures.
Summary for the Mid-Atlantic region:
1. slightly above normal temperatures (+1.0°C to +3.0°C) averaged
for the season; however, there will be occasional significant Arctic air outbreaks
2. numerous coastal storms leading to above normal snowfall
for the season - perhaps even a blockbuster snowstorm or two similar to other very strong El Nino winters (February 1983, January 2016)
3. seasonal snowfall amounts in the I-95 corridor:
20-30 inches in DC (normal amounts 13.7”)
30-40 inches in Philly (normal amounts 23.1”)
35-45 inches in NYC (normal amounts 29.8”)
4. worst winter weather conditions coming during the second half
Video discussion: